

Identifying Areas Most Likely to Suffer Recession Post Pandemic


Due to the current level of uncertainty surrounding the Covid-19 pandemic the effects of the upcoming economic recession are nearly impossible to predict; however history tells us that there are certain sociodemographic socioeconomic education and employment factors that expose certain groups of people to more severe consequences of an economic crisis. This time and unlike in 2008 the economic recession will arrive following a global pandemic. The non-Pharmaceutical interventions (NPIs) applied by governments around the world; such as school closures remote work policies and shelter-in-place (lockdown) strategies to limit intra- and inter-national mobility have caused additional havoc to certain economic sectors such as the retail and tourism industries. This also translates into an additional risk factor to the individuals making a living from the economic support generated by business activities in those jeopardised sectors.
Based on a series of aggravating socio-demographic and socio-economic factors this study attempts to identify areas in Spain that have a higher risk exposure to the upcoming economic recession. To help build the risk model a set of indicators have been used that relate both to the population and economic activity in these areas.

Datasets
In this study we collaborated with our data partner Unica360 and utilized some of their data products available in our Data Observatory.
The reasoning behind our selection of specific aggravating indicators from the different datasets available is as follows:
- Sociodemographics: Areas with more elderly population higher presence of younger people in lower income areas higher foreign population coming from lower GDP countries and areas with lower average income compared to the national average.
- Cadaster: Areas with more office commercial and industrial properties that may have seen lower activity due to the NPI measures.
- Commercial Index: Areas with higher presence of hostelry cultural and retail businesses that may have seen a decrease in activity due to the NPI measures.
- Tourism: Areas with higher expectancy of tourist visitors especially from foreign countries which may have been affected by the limitations and reductions in international journeys.
- Working Population: Areas with more employees working in offices which may have been affected due to the increase of remote work during the pandemic.
It is important to note that all these datasets are provided on a 100x100m grid covering the whole country.
For reference below is a listing of all features from the selected datasets used for the analysis:
Unica360 - Sociodemographics | |
p_ed_15_24_h (combined with income) | Ratio between the number of males with ages between 15 and 24 living in the area and the index of average income over national average |
p_ed_15_24_m (combined with income) | Ratio between the number of females with ages between 15 and 24 living in the area and the index of average income over national average |
p_ed_65_79_h | Number of males with ages between 65 and 79 living in the area |
p_ed_80_mas_h | Number of males with age +80 living in the area |
p_ed_65_79_m | Number of females with ages between 65 and 79 living in the area |
p_ed_80_mas_m | Number of females with age +80 living in the area |
inm_pobr | Population a priori economic immigrants |
renta_ind | Index of average income over national average |
Unica360 - Cadaster | |
n_ofi_inm | Number of offices |
sup_ofi_inm | Floor area of offices |
n_com_inm | Number of commercial properties |
sup_com_inm | Average floor area of commercial properties |
n_ind_inm | Number of industrial properties |
sup_ind_inm | Average floor area of industrial properties |
Unica360 - Commercial Index | |
ic_cultura | Culture index Includes: museums libraries book stores theaters |
ic_retail | Retail index. Includes retailers: all kinds of store fronts such as food fashion pharmacies banks beauty salons... Does not include: sanitary services (doctors physical therapists) places of worship hospitality public administration |
ic_hostel | Hostelry index. Includes: bars restaurantes cafés takeaway night clubs |
Unica360 - Tourism | |
t | Total tourists expected per year (without considering COVID-19 impact) |
t_extr | Total foreign tourists expected per year (without considering COVID-19 impact) |
Unica360 - Working Population | |
n_empl_empr_t | Number of employees |
n_empl_empr_sede | Number of employees in headquarters |
N_empl_empr_suc | Number of employees in branch offices |
Methodology
The risk index was calculated following the methodology outlined in the article "Deprivation index by enumeration district in Spain 2011".
The methodology builds an index using Principal Component Analysis (PCA) allowing us to reduce the dimensionality of the problem by capturing the majority of the variance in the resultant principal component.
Before applying PCA we need to perform some pre-processing on the input data. First we remove rows with insufficiently informed entries in their columns and then fill the missing values in the final subset of rows. To achieve this we used the median value of the municipality for which the data in that row partains. Once there are no missing values within the input dataset we standardize the data (a required step to run the PCA).
With the standardized data we then check the Spearman correlation of each possible pair of columns removing one if they show a Spearman correlation higher than 0.8. This equates to both columns providing the same information (and variance) meaning we can safely remove one of them. We then apply the PCA keeping only the first component (which will be our risk index).
Finally we check the Spearman correlation of each covariate against the first component of the PCA removing those with a correlation less than 0.4. We perform this step in order to maximize the variance captured by the first component. Then we recompute the PCA with the resultant covariates providing our final index.
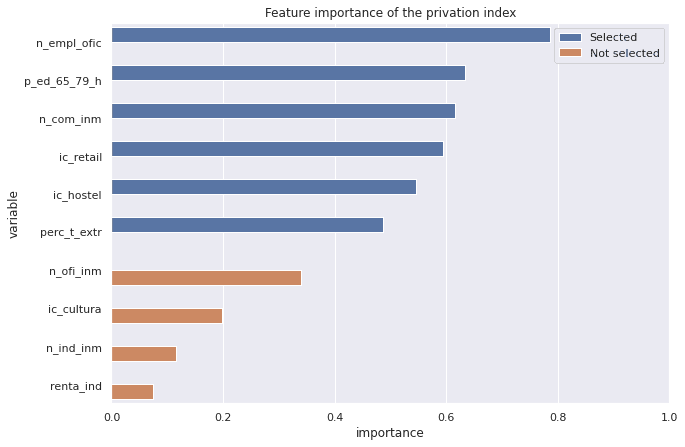
In the image below we can see the different features considered in the first run of the PCA (having removed correlated features) and the correlation of every feature with the privation index. This gives us a sense of the feature importance within our model. Those labelled in blue are the input features used for the second run of the PCA.
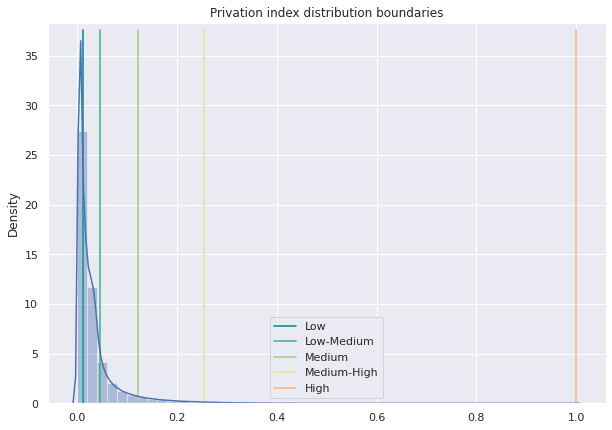
Next we compute a set of clusters for the index values so we can label each zone as having a low low-medium medium medium-high or high risk of being affected by the upcoming recession. To do this we apply the natural breaks (jenks) on the index values. This minimizes the variance between elements of the same cluster and maximizes the variance between elements of other clusters. In the image below we can see the values of the bins for the different risk categories resulting from the computation of the natural breaks.
Analyzing the Results
Performing a high level analysis of the results across different areas of Madrid we can see that areas with a higher risk (High or Medium-High) are those within the M30 orbital motorway and in the neighborhoods towards the south and south-west.
On the other hand areas with a higher concentration of cells classified as Low risk or Low-Medium risk are located within the north and north-west in neighborhoods such as Aravaca and Chamartin.
By looking closer at the distribution of the features belonging to the "high" and "low" risk categories and comparing their distributions with all cells within the city we can get a better understanding on what characterizes the cells in each cluster. For example the image below shows the comparison between the distributions of each feature in the "high risk" category and the overall distribution of the features in the whole city of Madrid.
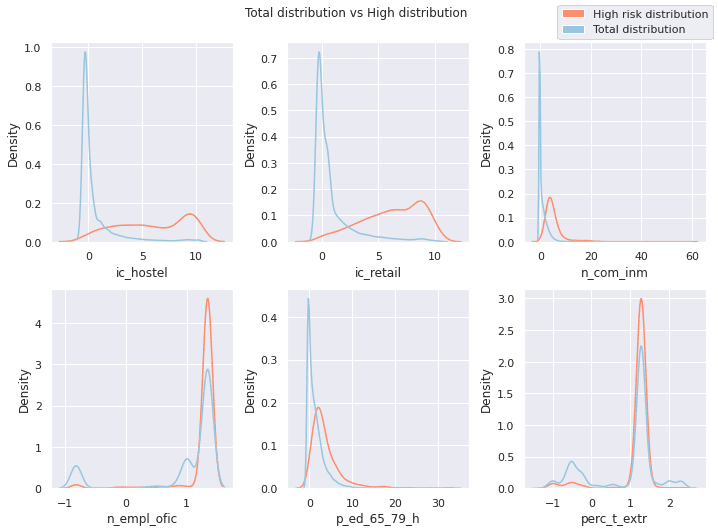
We can clearly see that "high risk" cells have higher values of every feature in the final set of aggravating factors. This means that "high risk" cells tend to have a:
- Higher presence of hostelry and retail places
- More elderly population living in the area
- Higher number of people working in businesses located in the area
- Higher volume of international tourists
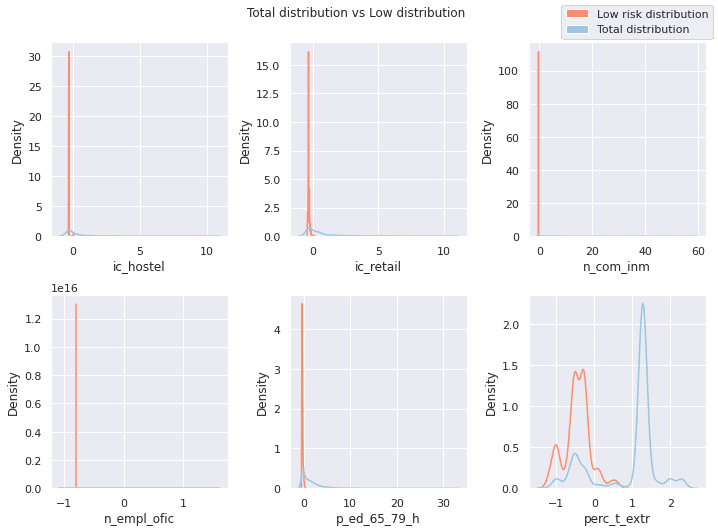
The same occurs if we look at the "low risk" cells where distribution tends to be positively skewed indicating that values are lower for these cells compared to the rest of the areas.
Looking at a different city Seville for example we can see that the distribution of high risk values is spread in two well-separated zones: the city center and the neighborhood of Triana. These two zones have a higher density of bars and restaurants and a higher expected presence of foreign tourism under normal travel conditions.
Also we discover that the vast majority of the cells with a low and low-medium risk index are located in areas surrounding the city center where there are more residential and less touristy neighborhoods.
Conclusions
As outlined during the introduction the aim of this study is to help identify areas in Spain that have a higher risk exposure to the upcoming economic recession.
Given the current global uncertainty along with the frequent and rapid changes in NPIs and governmental economic response it is extremely difficult to predict with accuracy how and where the recession will have the most impact. Therefore in order to make a more informed prediction we have leveraged commonalities from studies referencing other recent economic recessions.
This study also provides a good example of how to combine indicators from different data sources in order to build a derived index.
Want to see this in action?
 | This project has received funding from the European Union's Horizon 2020 research and innovation programme under grant agreement No 960401. |


