CARTO Workflows are here: no code spatial analysis


Update: 📣 CARTO Workflows is now out of beta and available to all users! Why not request a demo with one of our experts to learn how you can use no code analysis to solve your spatial problems?
In October we announced CARTO Workflows at the Spatial Data Science Conference in New York. Since then our amazing product team has been hard at work during our private beta phase learning from our customers, and refining Workflows to be ready for today’s exciting announcement - the launch of CARTO Workflows in public beta!
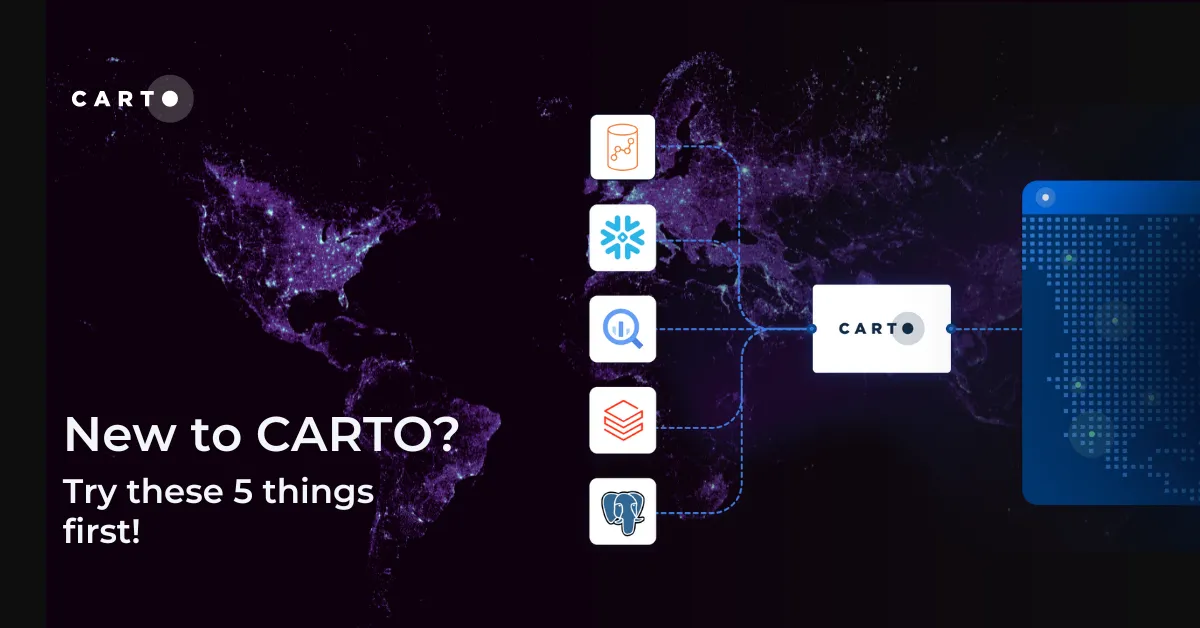
Our vision for Workflows is a no code analytical tool, which enables analysts of all skill levels and backgrounds to more easily leverage geospatial data and spatial analysis, using the power of geo-enabled data warehouses and databases. Today we are launching Workflows with support for the CARTO Data Warehouse, Google Cloud BigQuery, Amazon Redshift, Snowflake, and PostgreSQL/PostGIS.
Breaking down the barriers for geospatial analytics at scale
Workflows is particularly exciting because it allows a new set of users access to geospatial analytics running in a cloud-native environment for the first time. Traditionally, using these tools always came with the prerequisite of having the ability to use Spatial SQL, or the time to learn it. Workflows gives you the same control and power as if you are writing SQL yourself, and all this through a completely visual interface. Check out the example below.
A simple spatial join workflow, executed entirely using a simple visual user experience. But here is the key difference: we are joining all 26 million nodes (or points) in the United States to all US Counties from OpenStreetMap, in a matter of seconds and natively in the cloud.
You can use any data source in your data warehouse or database, and even import remote files from websites that will update each time the workflow is run. You can visualize data and results at each node along the way to see when issues arise and validate results. This gives you complete control over your work. You can also easily add or remove nodes without breaking the rest of the workflow. Workflow steps run independently so you can test them along the way.
An intuitive and familiar interface
We are particularly excited about the potential that Workflows has to enable new users to access the power of a modern geospatial data stack in the cloud using tools that feel familiar and easy to use. Workflows utilizes an intuitive “flow diagram” design which is common across no code analytical solutions like Alteryx, FME, ArcGIS Model Builder, and the QGIS Graphical Modeler.
While Workflows and CARTO focuses on geospatial data, we have started to see users and teams bring their skills from tools like this to automate not only geospatial processes, but also other data workflows which has given us great validation about the intuitive design we set out to build.
Workflows offers a wide range of analytical and data processing functionality, with geospatial functions that include:
- Creation of new data, such as tilesets of geometry constructors
- Data import and export, including from URLs or to email
- A wide suite of spatial analysis tools such as spatial joins & filters, clustering and creating isolines
- Spatial property analysis, such as measuring areas, lengths and angles
- Tools to leverage Spatial Indexes such as H3 and Quadbin.
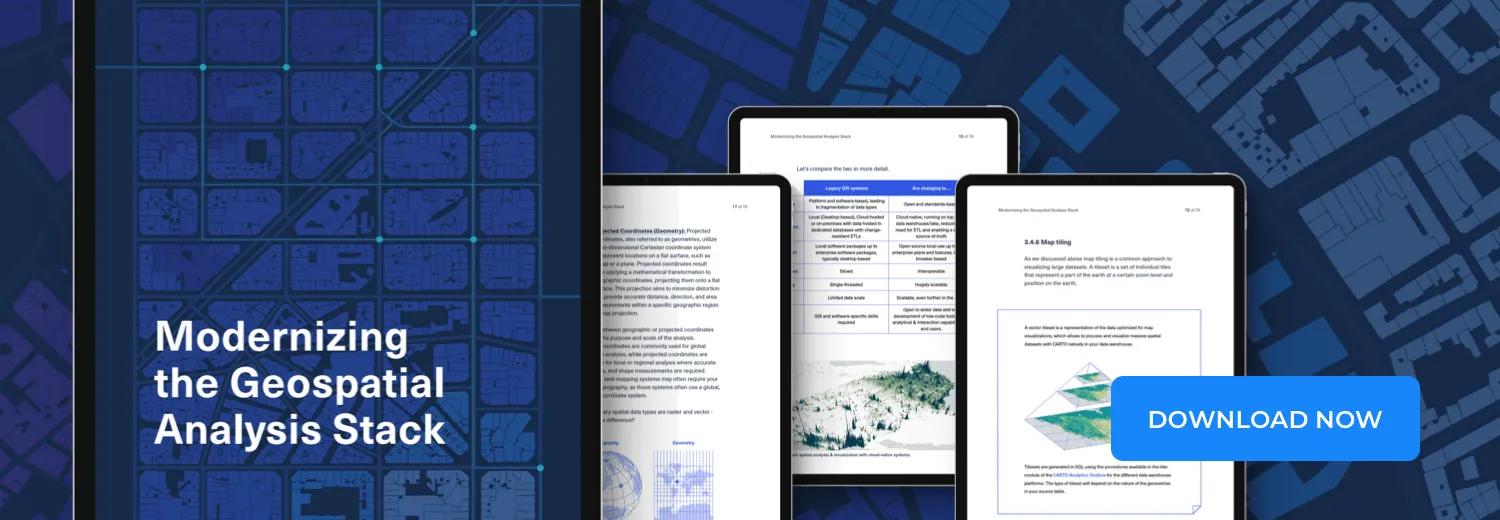
Access the ultimate guide to navigating the new geospatial landscape. Download the free report: Modernizing the Geospatial Analysis Stack today.
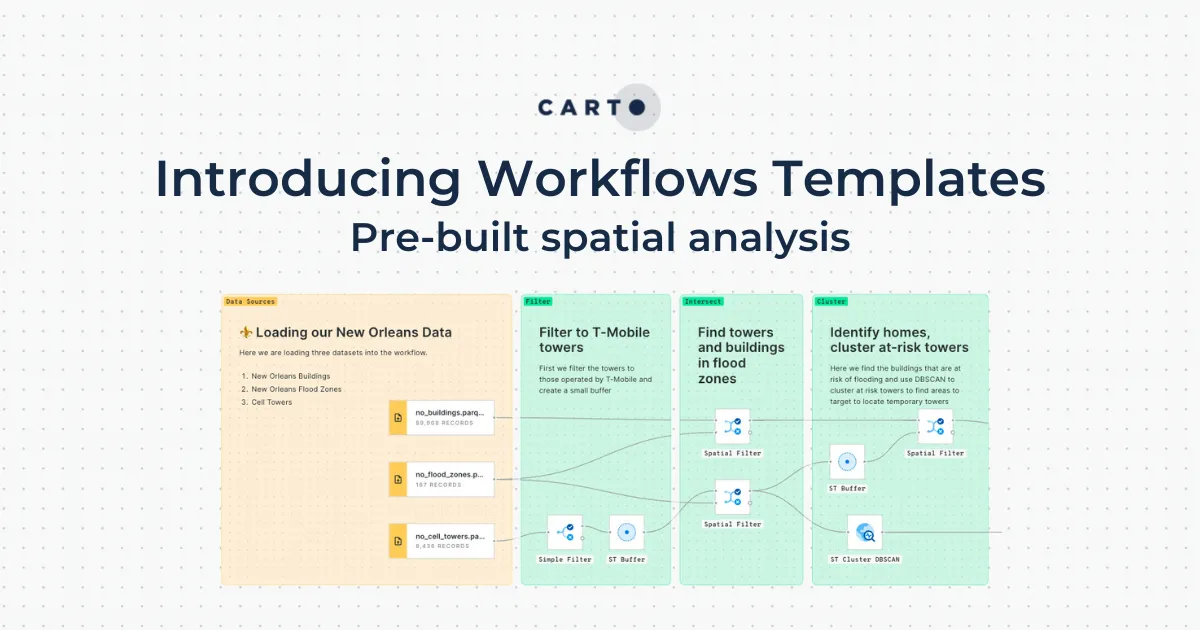
An example workflow: Finding stores in areas with weather risks
Let’s take a look at an example workflow.
In this demo, we are ingesting data from a remote file containing temperature forecasts for the US and weather risk data from NOAA. We can then join that data to our own store data (in this example Kroger stores) to identify the stores that have weather risks and deviations in temperature. We can then email this weather risk data directly to key stakeholders. In the final step, we can create a table from the output data and build a map to share as a dashboard. Every time I run the workflow, the data will be updated along with the map.
Start using Workflows today!
You can start using the beta version of Workflows today. You can access the module in the CARTO workspace in your current CARTO account, or sign up for a 14 day free trial. If you are a student, you can use the GitHub Developer Pack to get free access to CARTO here.
If you want to test out workflows to migrate geospatial workloads or processing, please reach out to us here as we are offering structured proof of concepts to assist in creating new Workflows or migrating to CARTO from other tools.