Introducing CARTO Workflows: Spatial analytics for all users


Today at the Spatial Data Science Conference in New York City we announced CARTO Workflows, an exciting new tool that enables users of all types and skill levels to harness the power of cloud data warehouses, spatial SQL, and advanced spatial analytics.
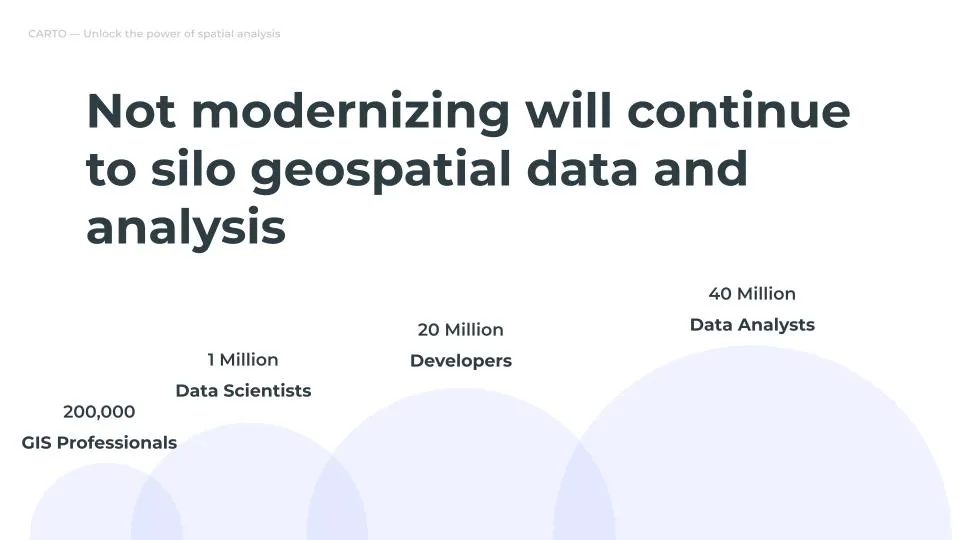
Spatial data and analysis are increasing in complexity and scale. It is no secret that more and more geospatial data is being produced. Larger volumes of data and more frequent updates mean insights derived from geospatial data can become stale quickly, and business demands for accurate updates are only increasing.
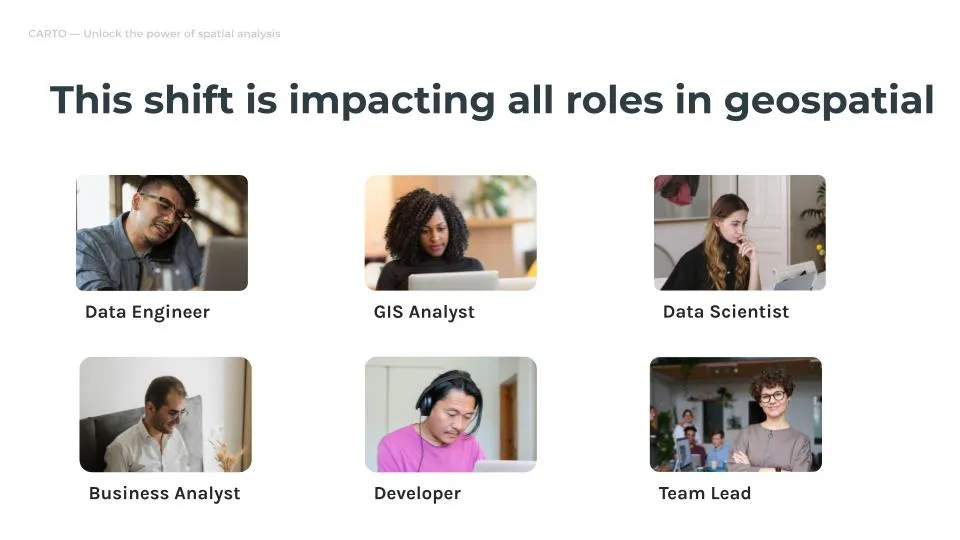
This shift puts an increased burden on geospatial teams and roles of all types. From data engineers who need to create consistent and scalable pipelines, to analysts who need to ensure data is accurate and up to date, to data scientists and developers who have to work with larger volumes of data, all of which can slow progress down.
Traditional infrastructure cannot meet the demands of the modern geospatial team.The good news is we have the tools to solve these problems. Cloud data warehouses that make use of spatial SQL provide a scalable and cost effective infrastructure to manage larger volumes of data. Spatial indexes like H3 and Quadbins make data storage and querying much more efficient. And new file types such as Geoparquet or Cloud Optimized GeoTIFF make data interoperability between systems even more performant.
However these can be difficult to implement in practice. For example, implementing a complete shift to H3 as a geospatial indexing system can be complex depending on your technical stack, while still having to deliver on critical business demands. This complexity only increases with the scale and volume of data - a task as simple as creating a dashboard can become overwhelming quickly.
These shifts make it even more important to be able to unlock accessible data and insights across your organization. The risk of siloing geospatial data and insights for critical decisions is high given the current specialized knowledge and tools used by geospatial teams.
There is a better way
For close to two years, we have been working on the vision of a complete geospatial platform that leverages the power of the cloud, in particular cloud data warehouses. We believe there are three major shifts that are driving innovation in geospatial analytics today:
- The increase in geospatial data volumes will only increase in the future, along with the demand for faster, more accessible analytics.
- We have the tools to serve these needs, but they need to be more accessible to a broader range of users who want to perform spatial analysis.
- Data warehouses and spatial SQL provide a powerful and scalable toolkit for spatial analytics in the cloud.
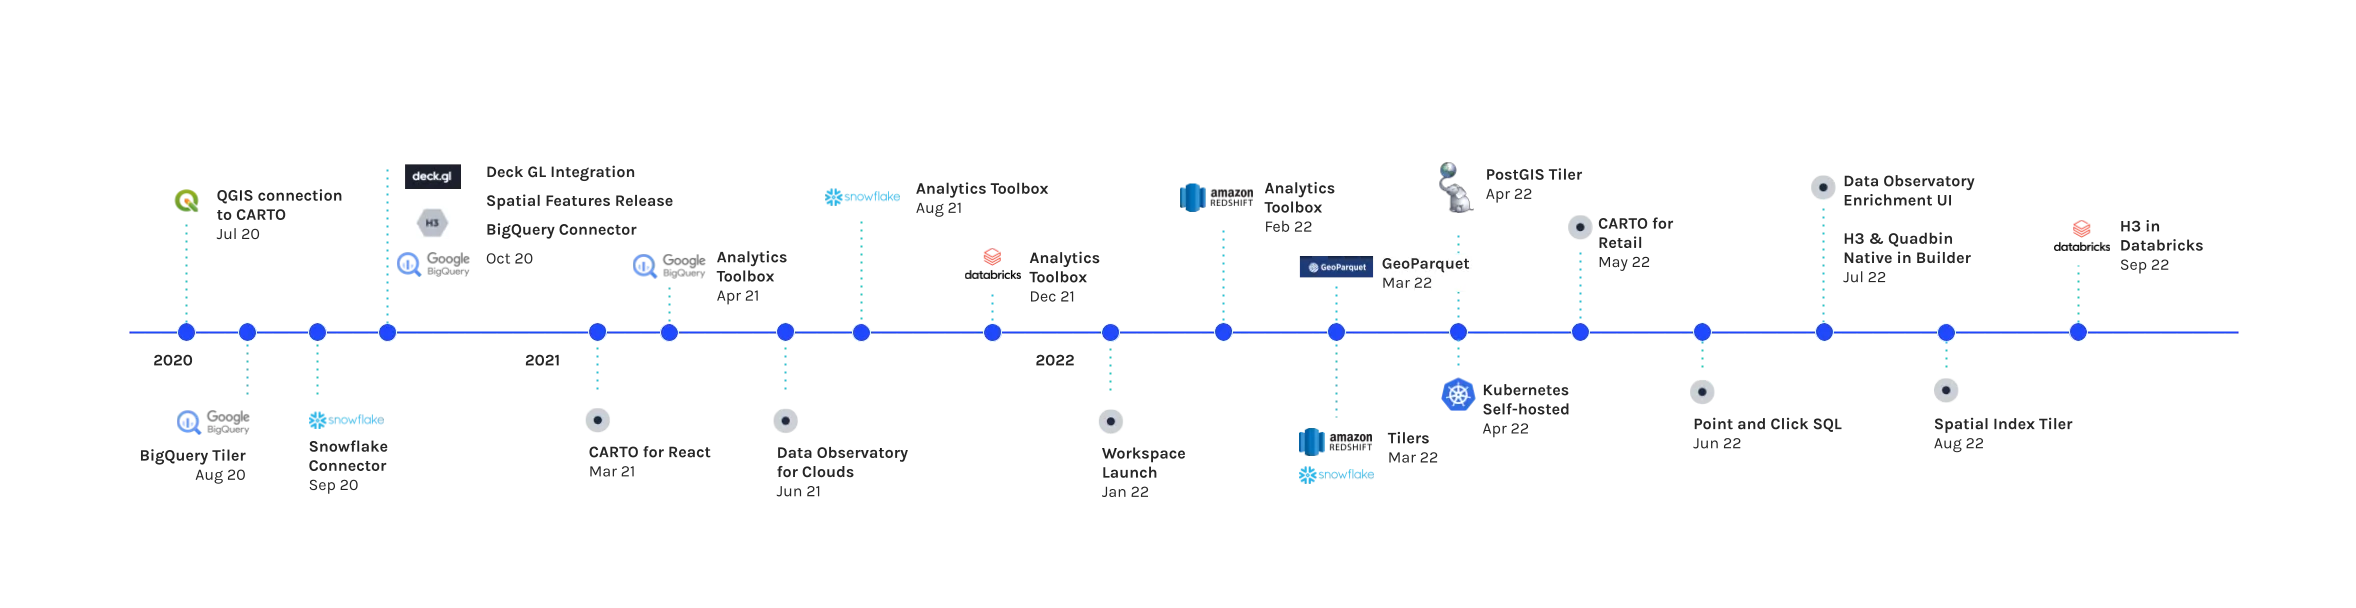
It is this vision that we have been working towards and building since 2020 with open-source components and alongside our amazing cloud partners, including Google Cloud, Snowflake, AWS and Databricks.
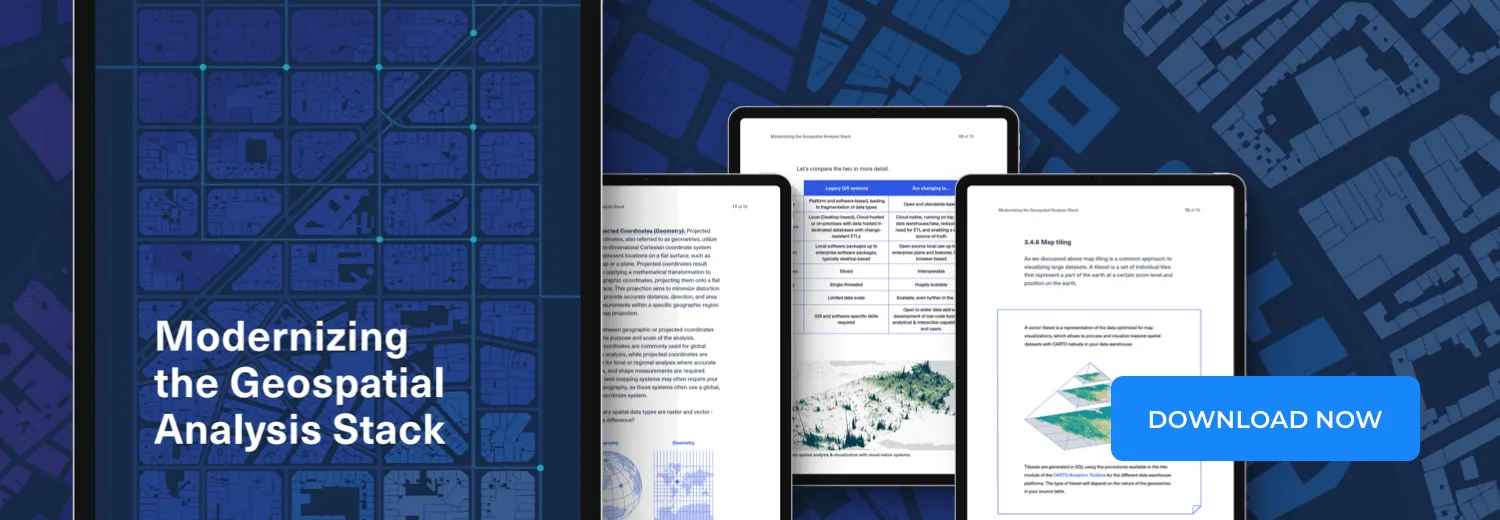
Access the ultimate guide to navigating the new geospatial landscape. Download the free report: Modernizing the Geospatial Analysis Stack today.
Spatial SQL is powerful but still underutilized
Spatial SQL provides a common language that can be used to perform spatial analysis and harness the parallel processing power of data warehouses. With that said spatial SQL can be simple but generally looks more complicated in practice.
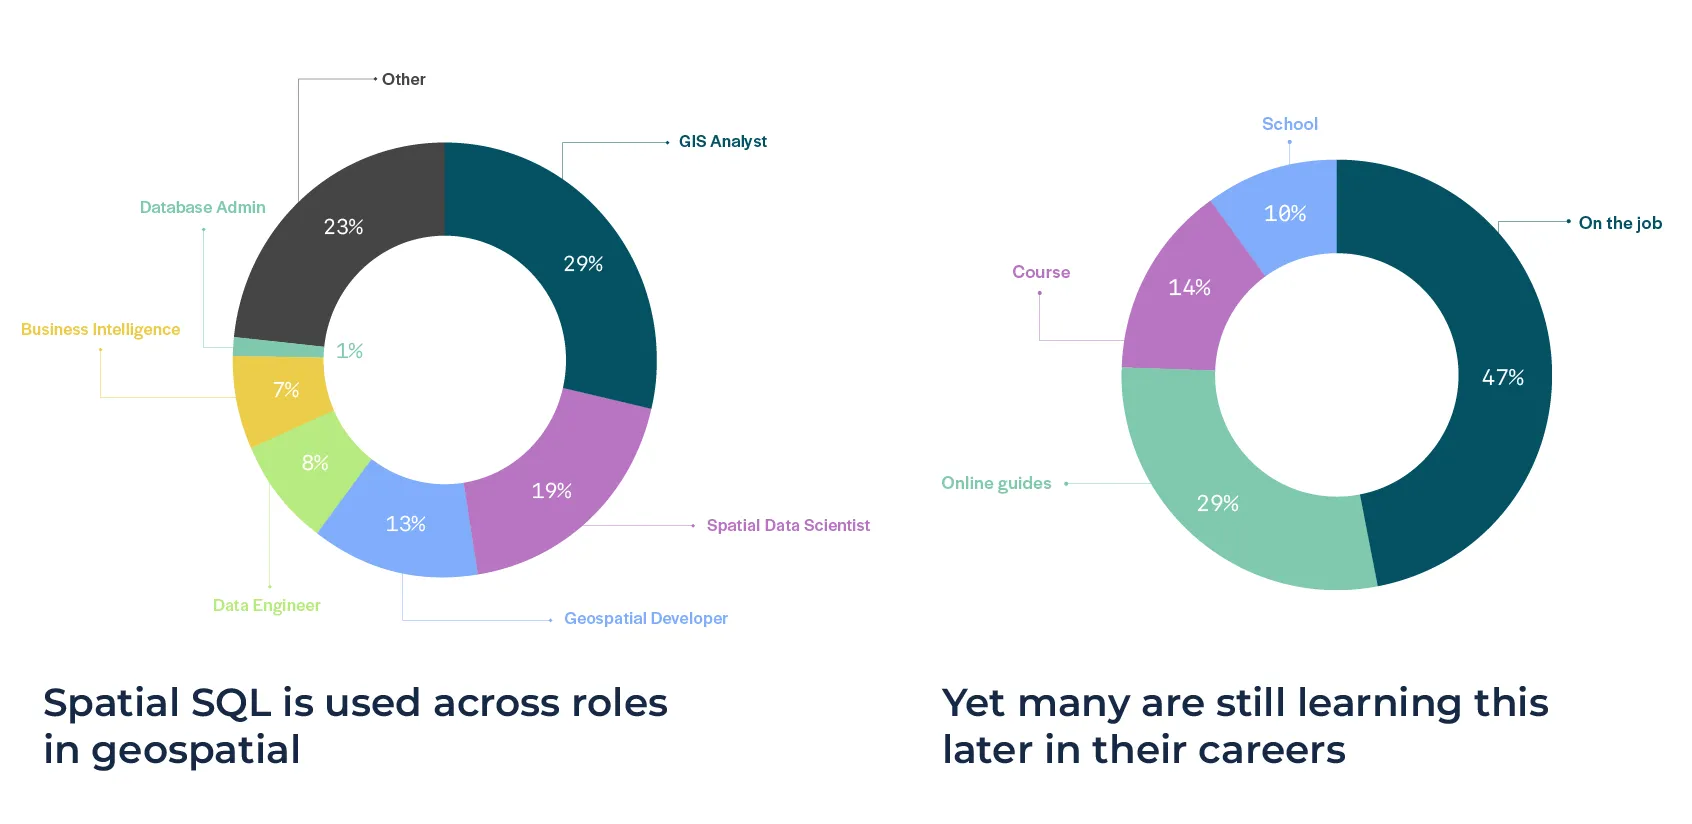
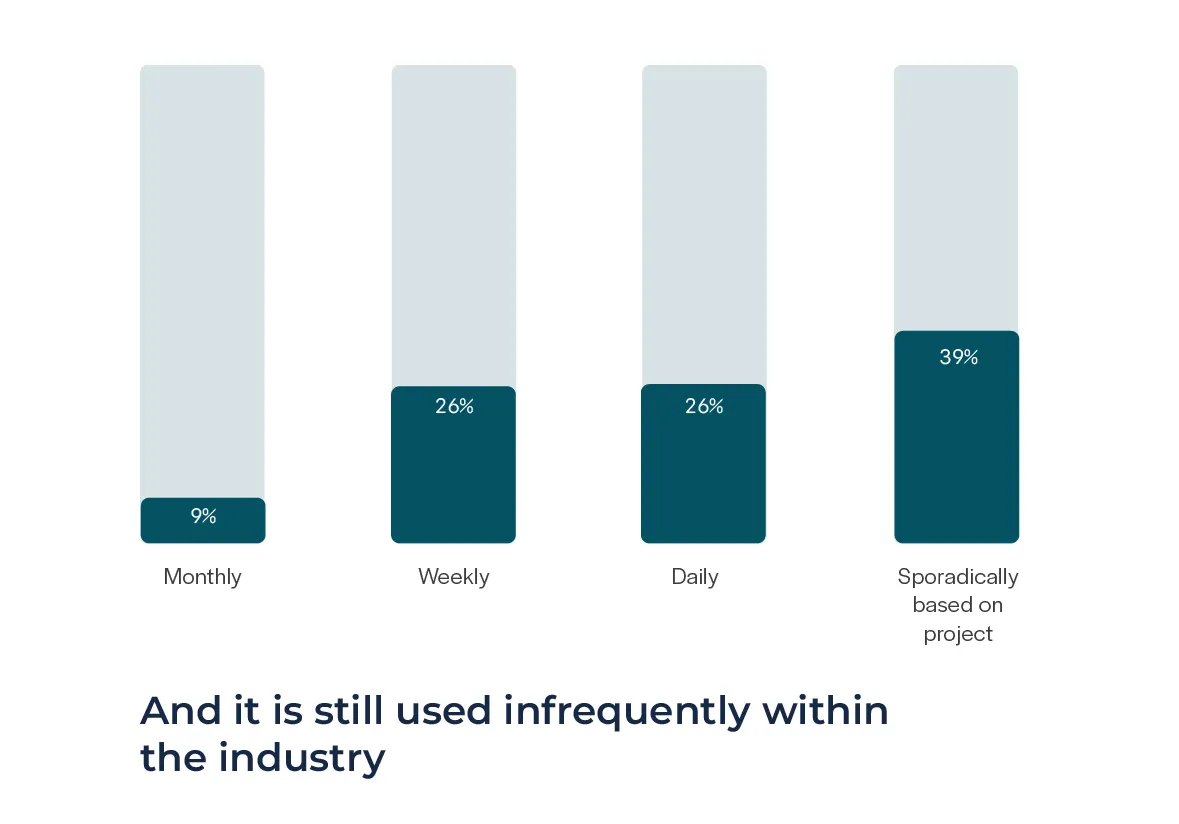
We can also see this trend. In the State of Spatial SQL Report, we found users of all types are using spatial SQL: Yet spatial SQL is generally learned on the job or independently, and 74% of respondents are only using it weekly or less:
Introducing CARTO Workflows
CARTO Workflows is built on the premise of making this analytic power more accessible, for users of any skill level or role.
Workflows allow you to:
- Leverage the advantages of data warehouses and spatial SQL.
- Use an analytical modeling tool in a familiar, visual interface.
- Provide impact for all skill levels and roles.
- Design repeatable analysis using core spatial SQL analysis alongside tools from the CARTO Analytics Toolbox like H3 or Quadbin spatial indexes, routing, geocoding, Data Observatory enrichment, and more.
Workflows can be scheduled to run at specific times or based on changes to data inputs in remote files or data in your data warehouse. You can create CARTO Builder Maps, export data, send emails, and more as outcomes of Workflows. Each workflow can be parametrized, duplicated, combined, and shared.
Identifying wildfire risks using CARTO Workflows
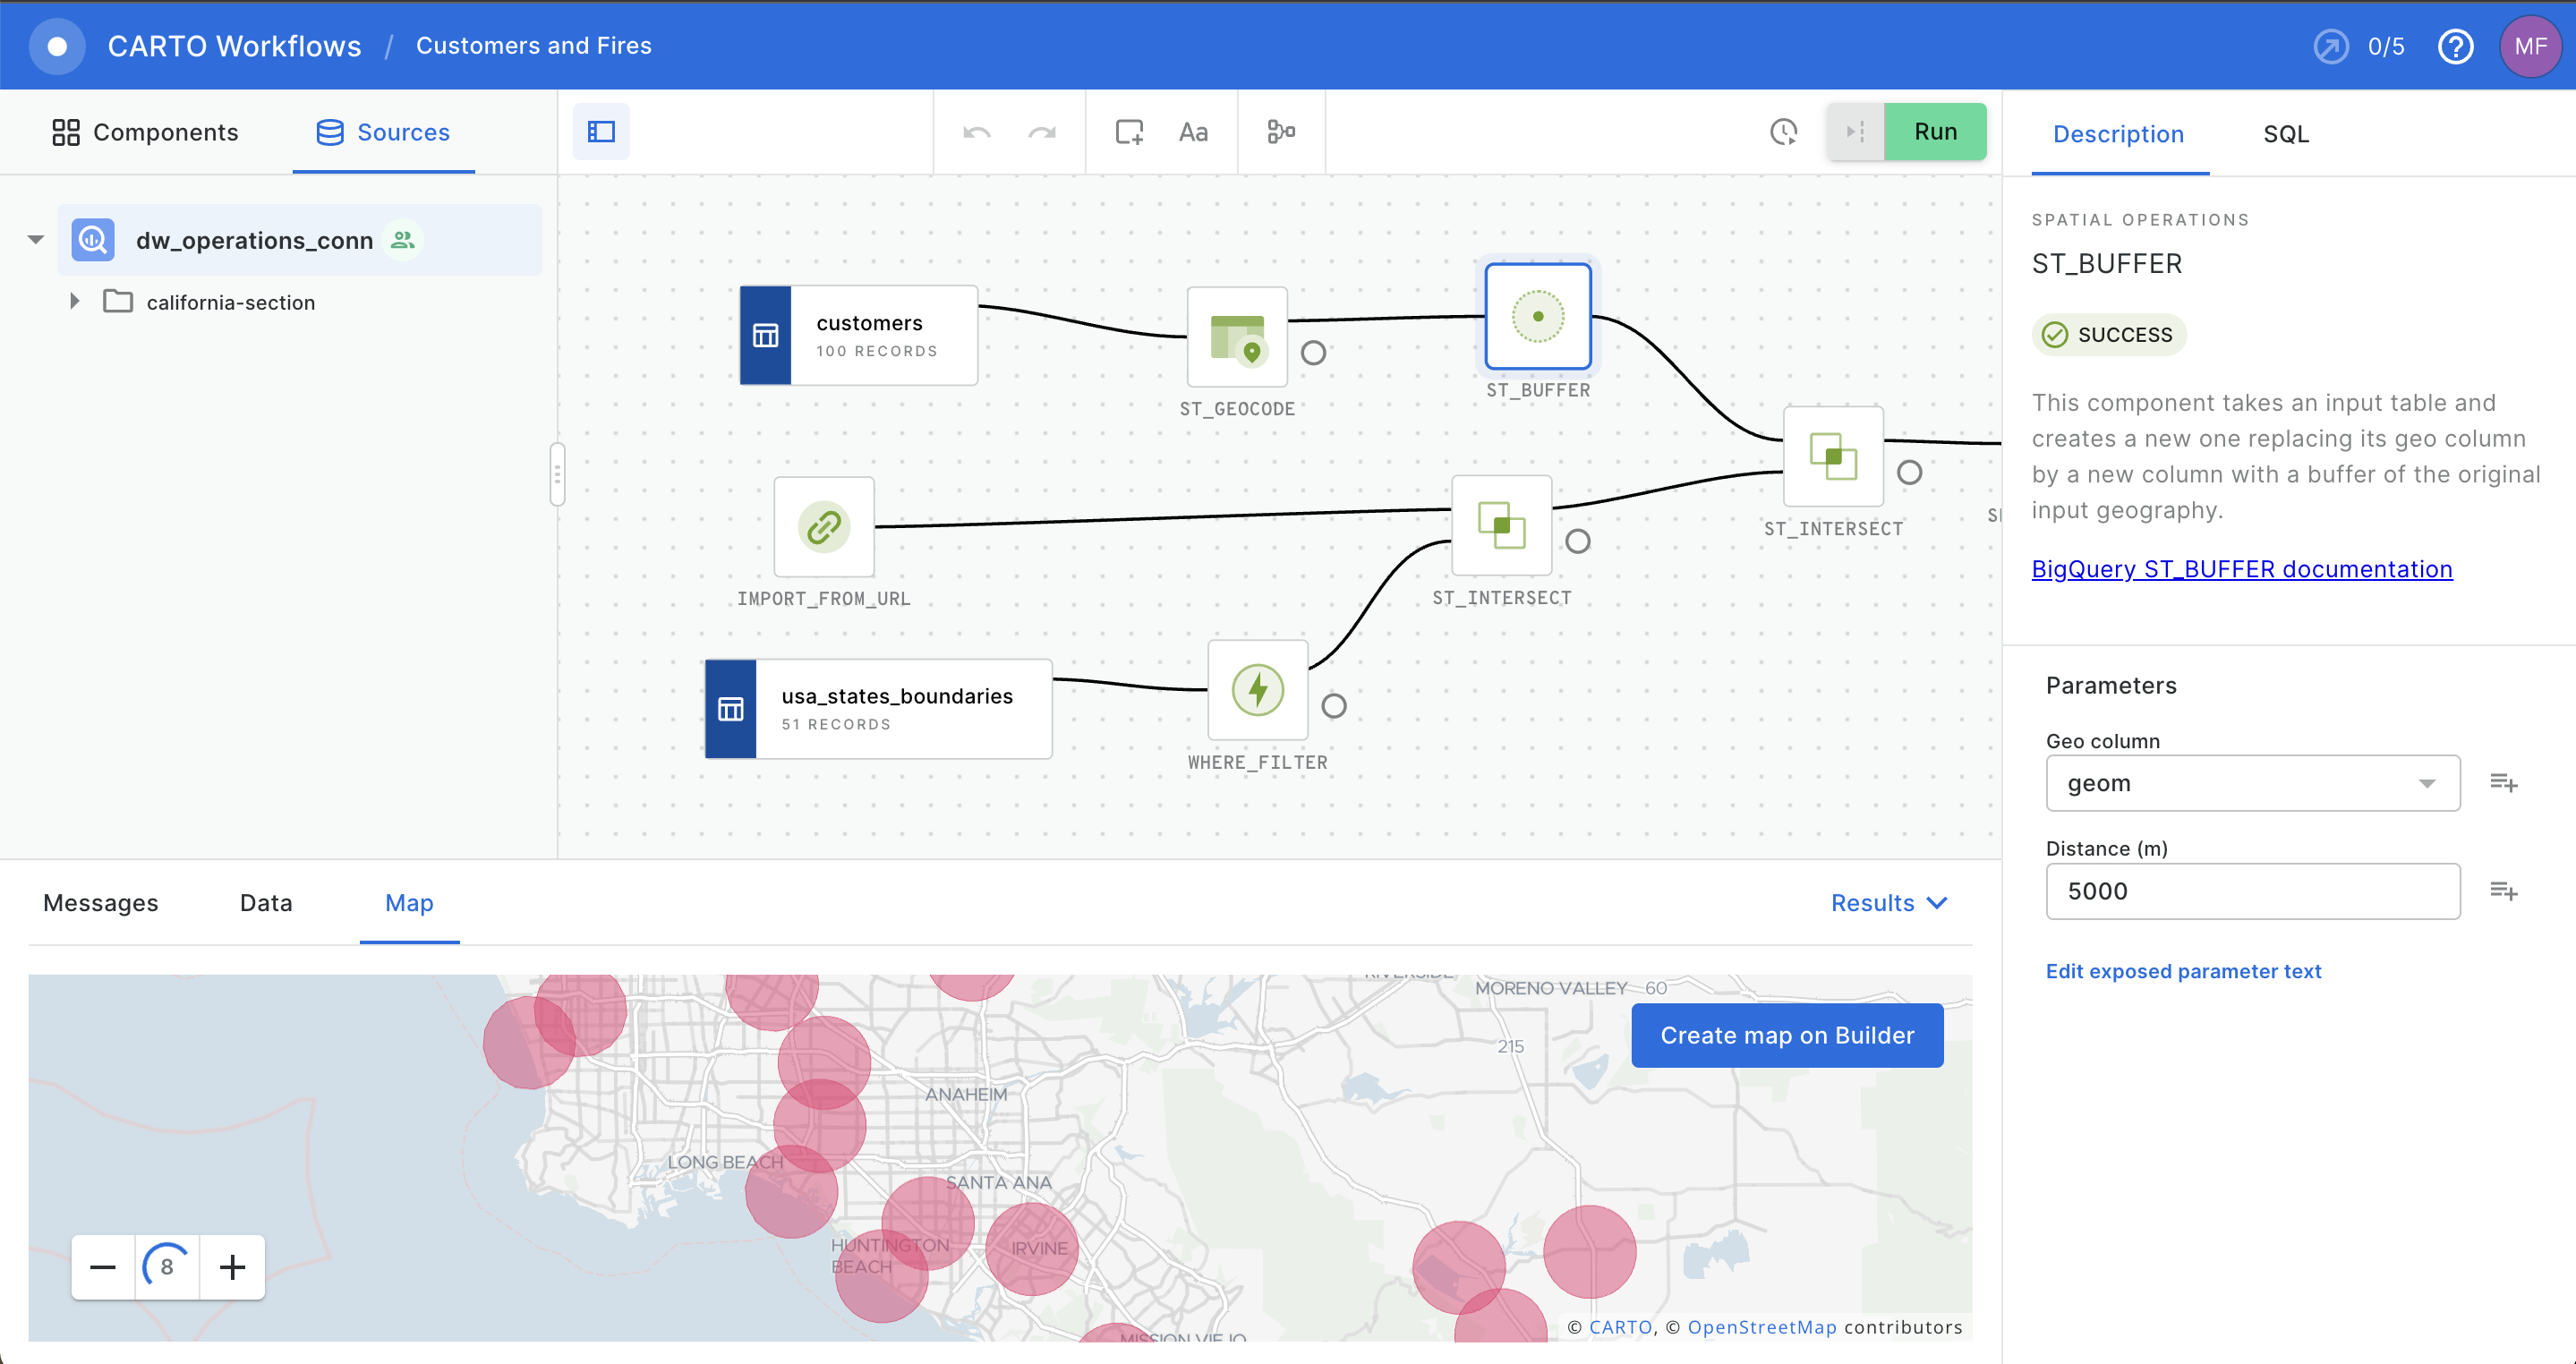
Let's take a look at this in practice. First we can take a list of customers, and geocode those addresses to add points to the dataset. We can also import the Wildfire Risk Dataset from NASA with an import node. Since we only want to see results in California, we can then grab a dataset of state shapes and filter it to only show California. From here we want to perform a spatial join to find fires within the state. Next we want to ensure we find customers that are near fires, not only within the fire area with a buffer of 50km.
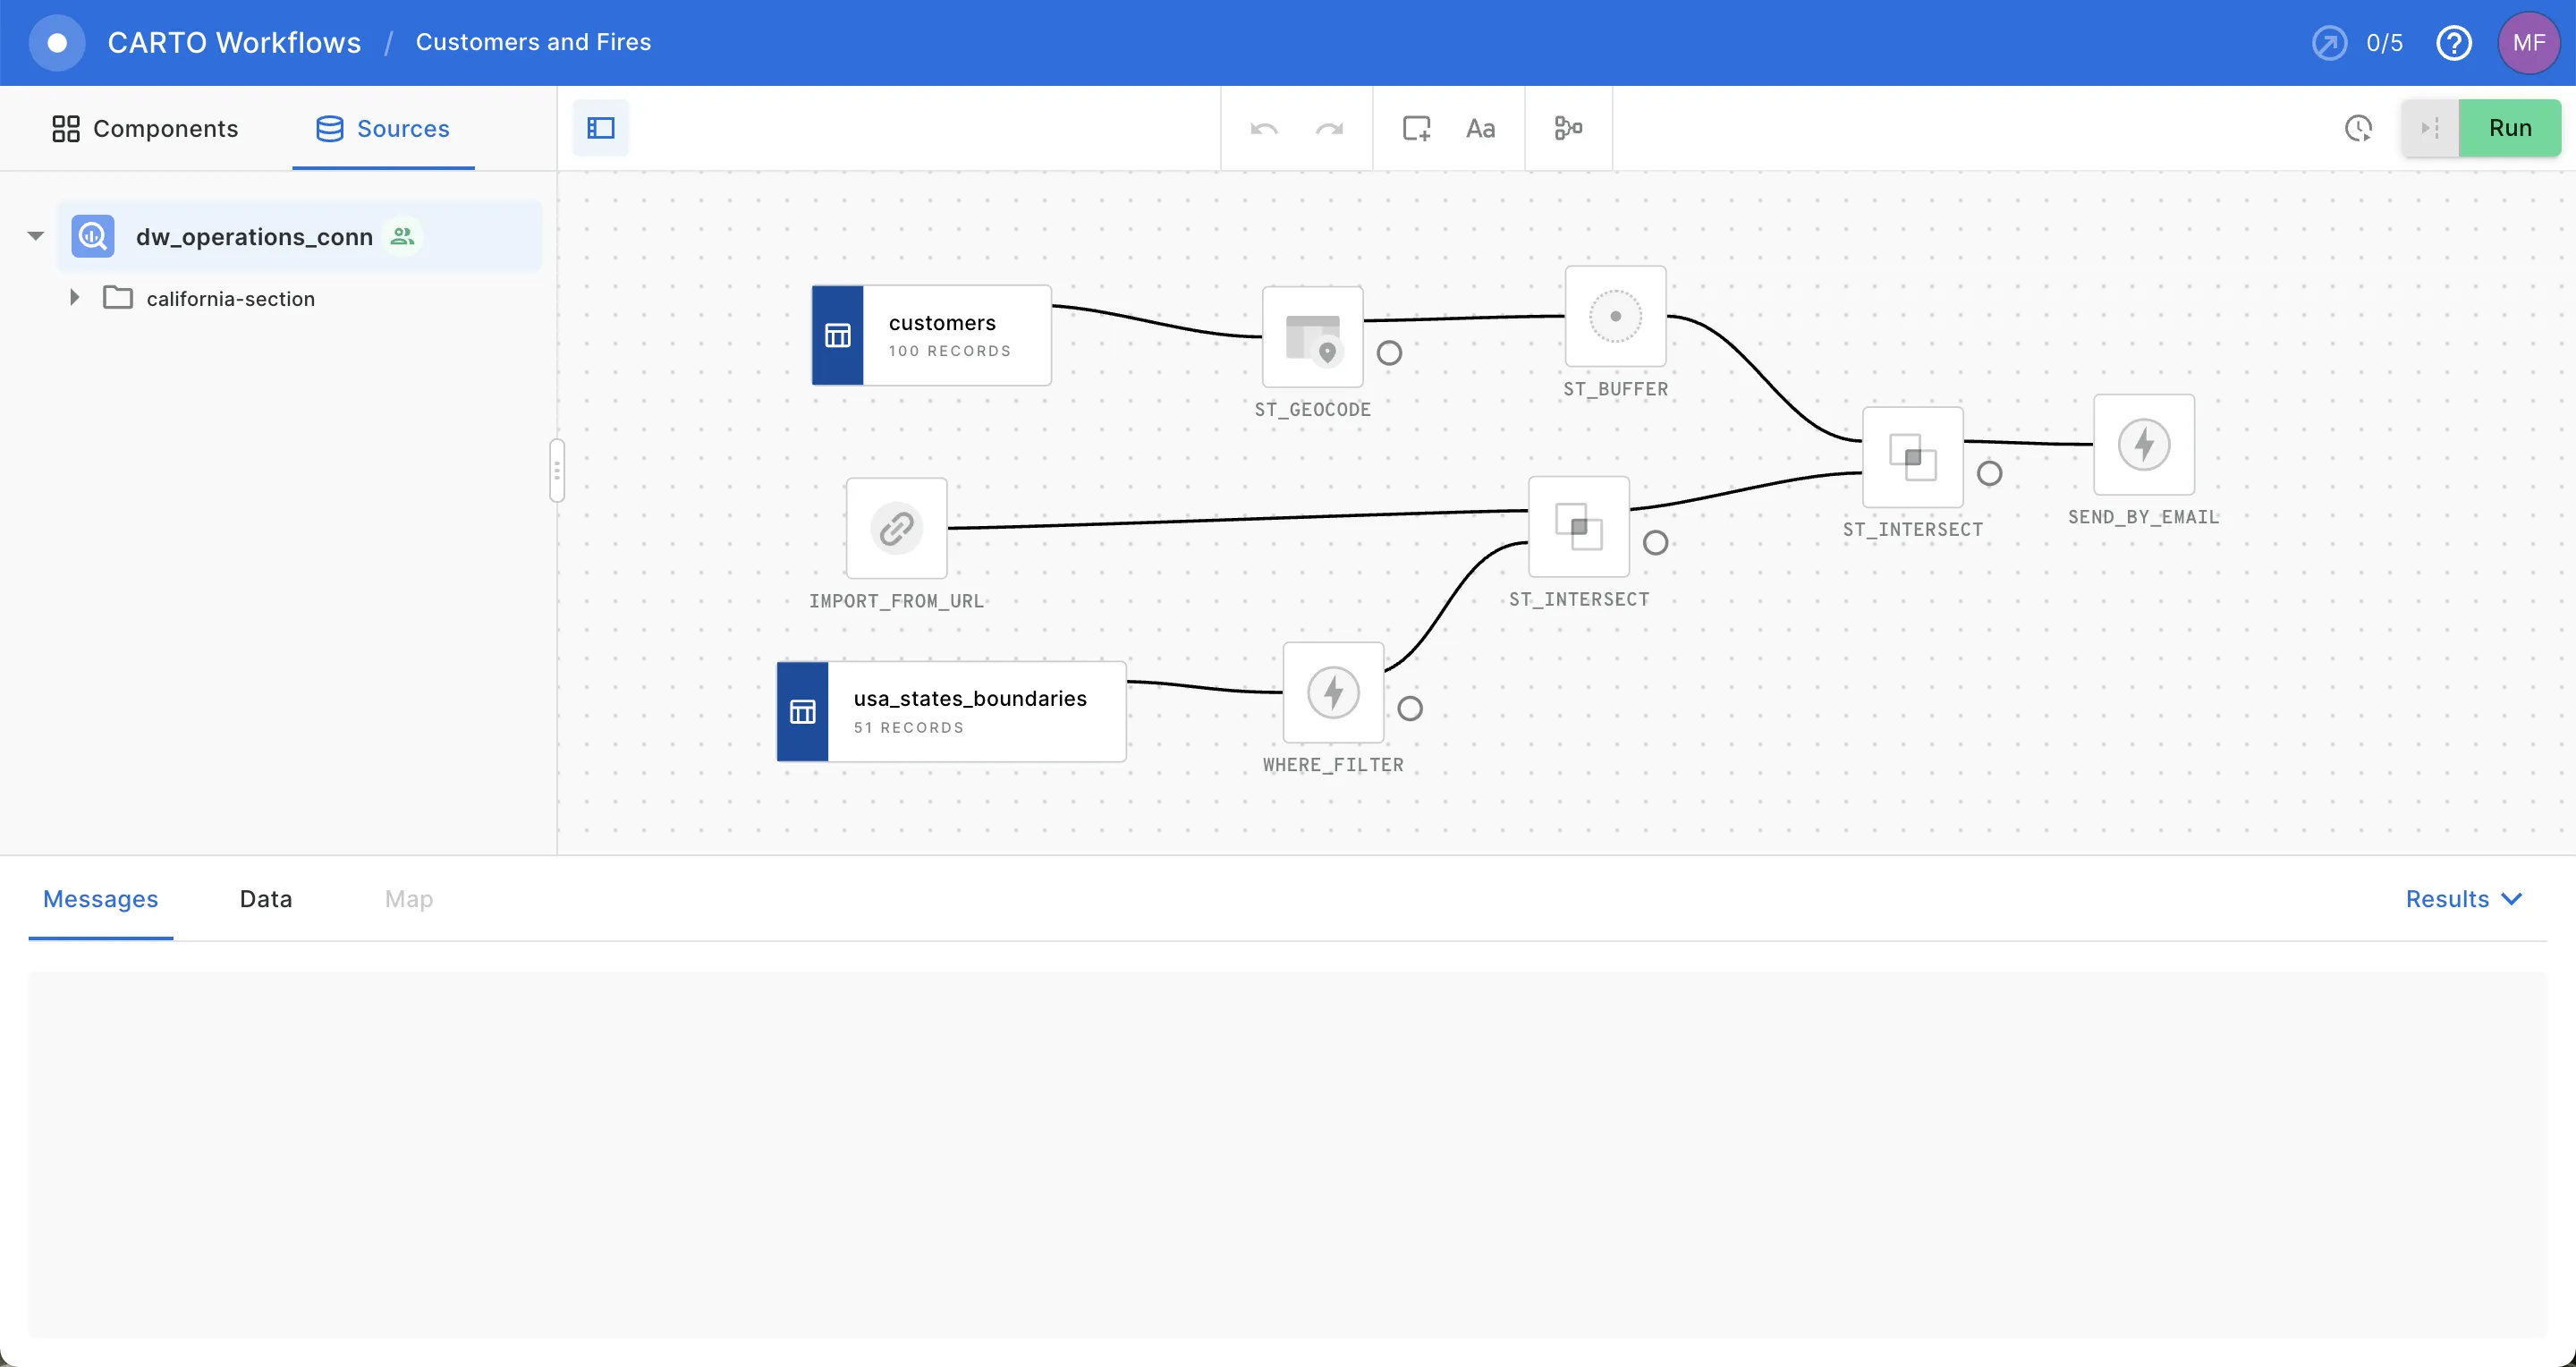
Finally we can join the buffered customer locations and the fires in California. The final output of the Workflow will be a CSV report sent via email to the necessary stakeholders.
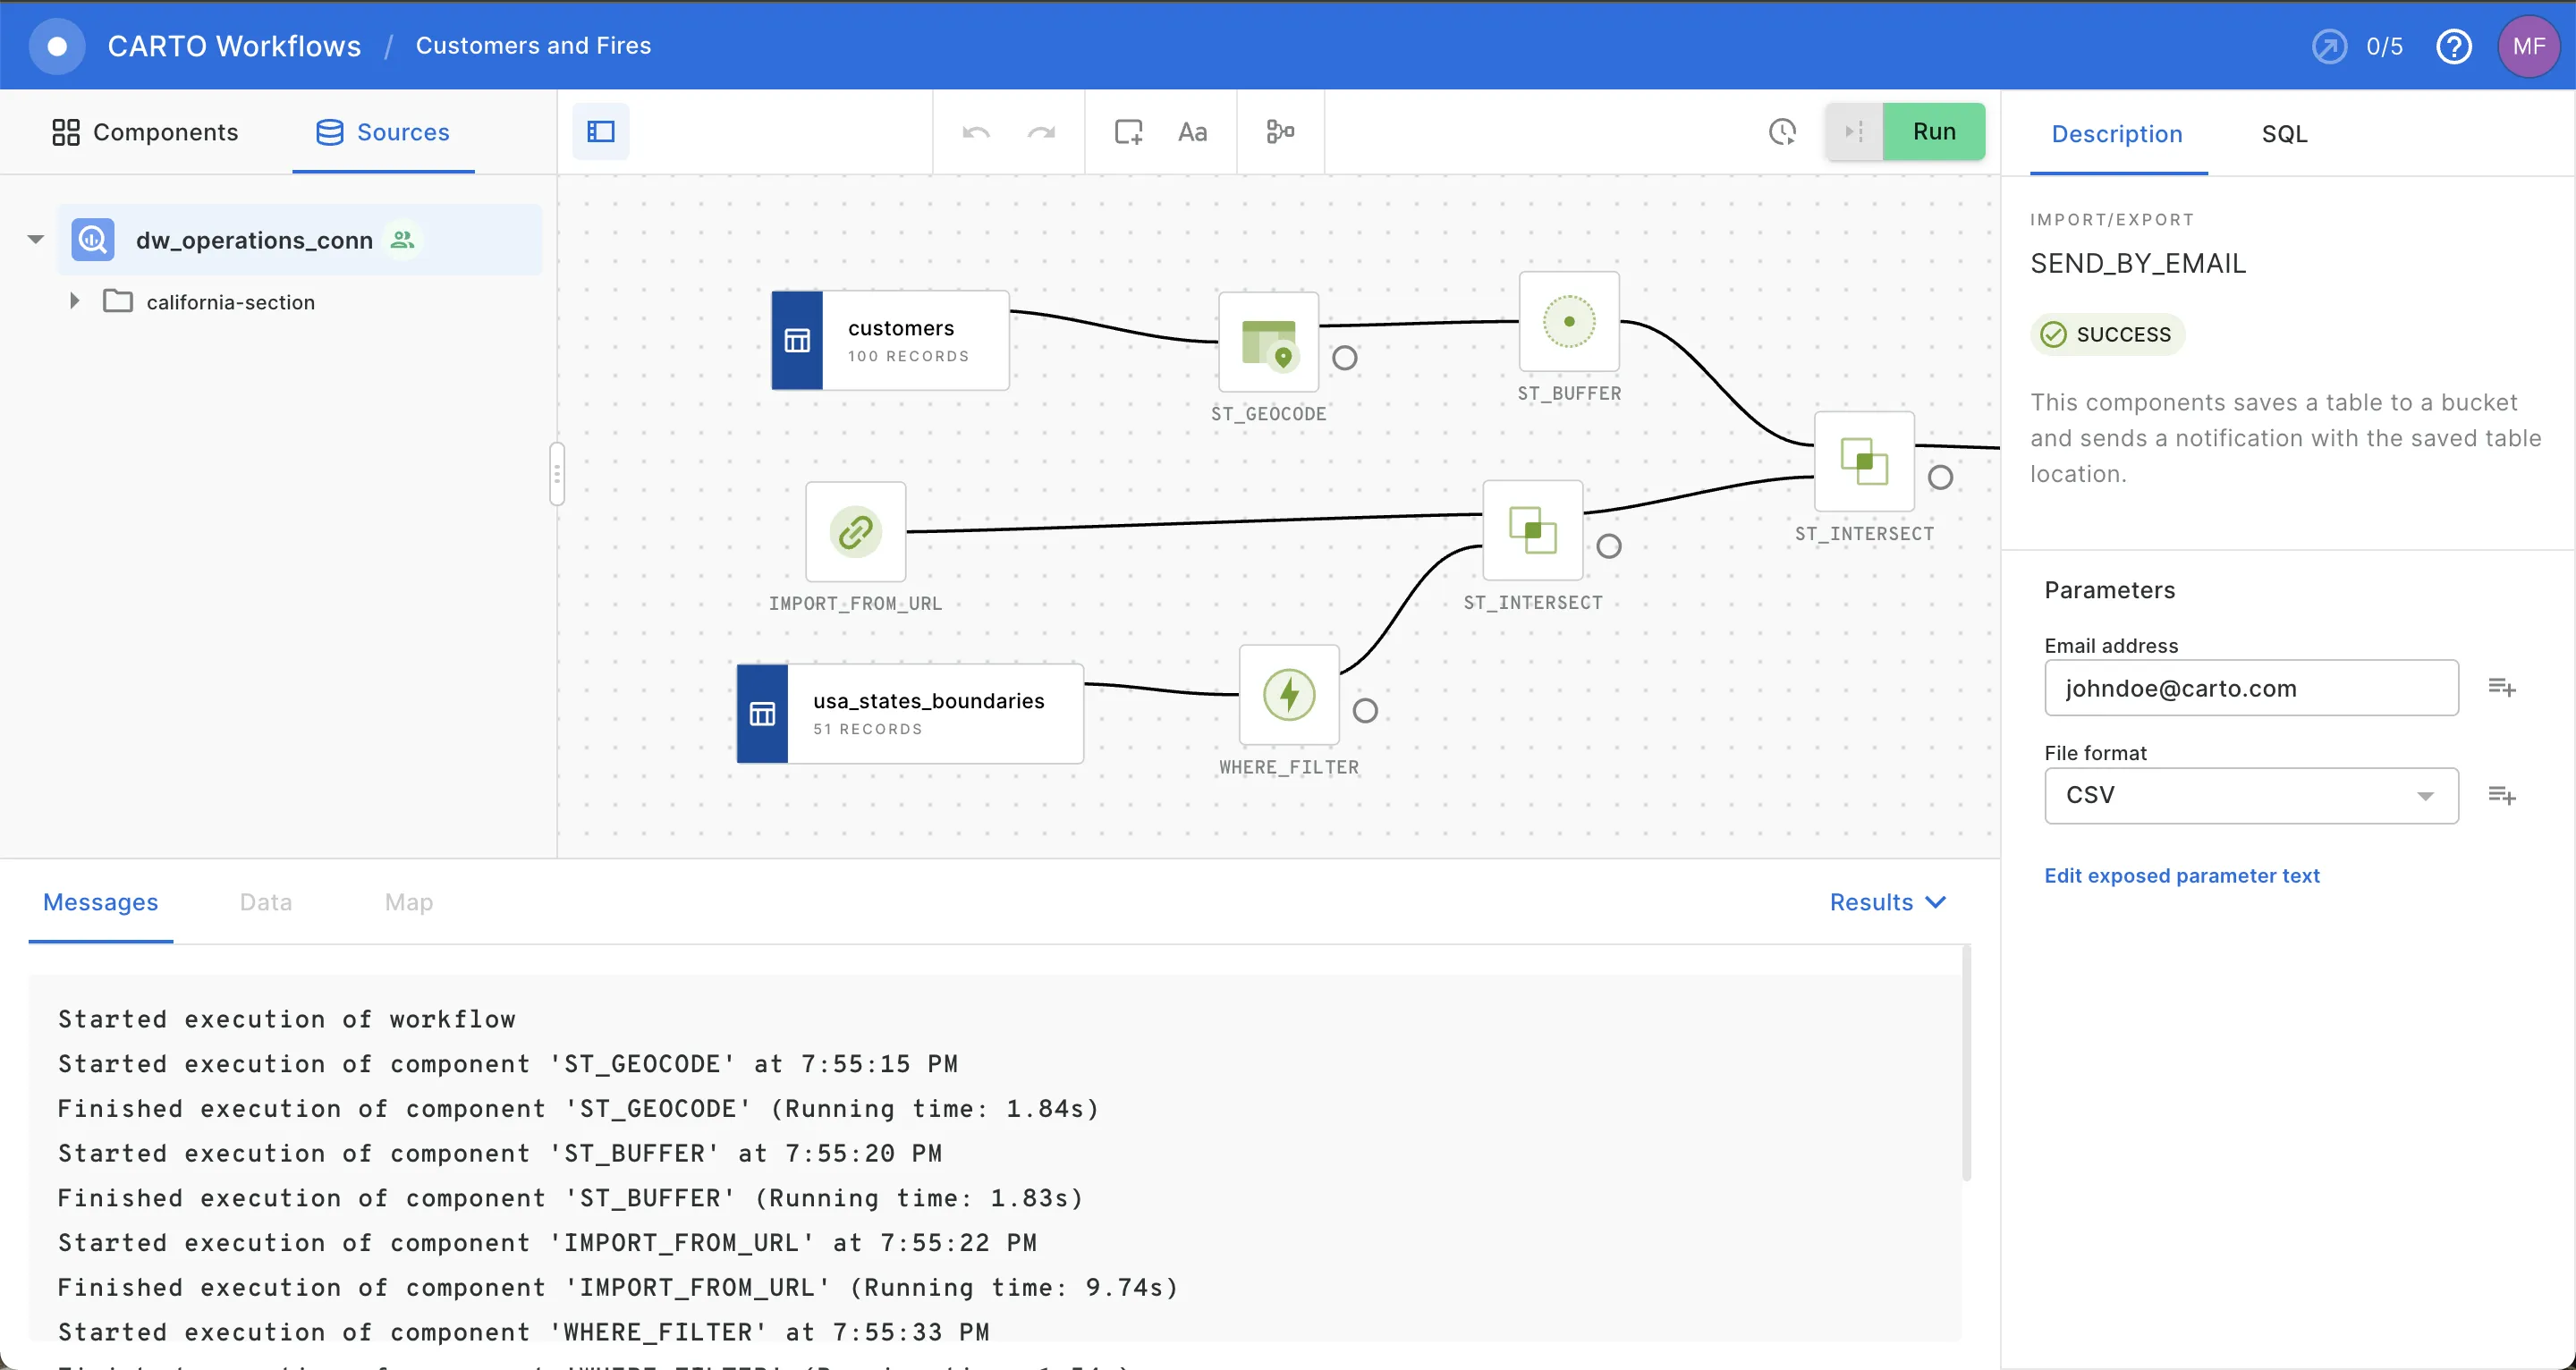
At any point you can see the results of the analysis and make changes to the Workflow at any time by adjusting any single node.
Below is the comparable SQL to run the analysis in this Workflow, not accounting for the CSV export and email trigger.
WITH
--Source datasets
  customers AS (SELECT * FROM california_section.crm_data.customer)
  geocoded_customers AS (ST_GEOCODE(
      customers
      address
      'United States of America') AS geom)
  nasa_fires AS (SELECT imported.* FROM (
      SELECT URL_IMPORT("https://www.earthdata.nasa.gov/learn/find-data/near-real-time/firms/active-fire-data#"  true) as imported)
  state_boundaries AS (
      SELECT * FROM california_section.spatial_data.usa_states_boundaries
      WHERE name = 'California')
–Intermediate analysis
 nasa_fires_california AS (SELECT nasa_fires.*
   FROM nasa_fires  state_boundaries
   WHERE ST_INTERSECTS(state_boundaries.geom  nasa_fires.geom))
 buffered_customers AS (SELECT
   carto-un.carto.ST_BUFFER(customers.geom  5000  “meters” 8) as geom from customers)
–Final analysis
SELECT nasa_fires_california.* FROM nasa_fires_california  buffered_customers
   WHERE ST_INTERSECTS(buffered_customers.geom  nasa_fires_calfornia.geom)
A more accessible geospatial toolkit
CARTO has always worked to make advancements in geospatial accessibility for all users. Workflows represents our newest effort in this area, to bring modern techniques and scale to a wider audience. Everything from simple enrichment, dashboard creation, spatial models, feature creation, and more can be built with workflows. You can create any number of outputs:
- Send a dataset via email.
- Create a new table in your data warehouse.
- Build a map from a workflow output.
- Send a Geoparquet file for use in Geopandas.
We are excited to see how you will make use of Workflows in your work. We are currently in a private beta, and releasing the public beta in the coming weeks. Please sign up below if you are interested in participating in the beta evaluation process, as your feedback will be critical to make this new tool helpful for all users.