Opportunity Zones in the Wake of Amazon HQ2


To say that Amazon's HQ2 decision proved divisive would be an understatement. Whether Jeff Bezos selected the neighborhoods of Crystal City in Arlington Virginia and Long Island City in Queens New York because of their proximity to the political and economic centers of the U.S. or because he owns homes in each area or both many are criticizing the e-commerce giant for its year-long site planning contest where local officials in 236 U.S. cities dedicated limited resources on proposals to attract Amazon that could have been better spent.
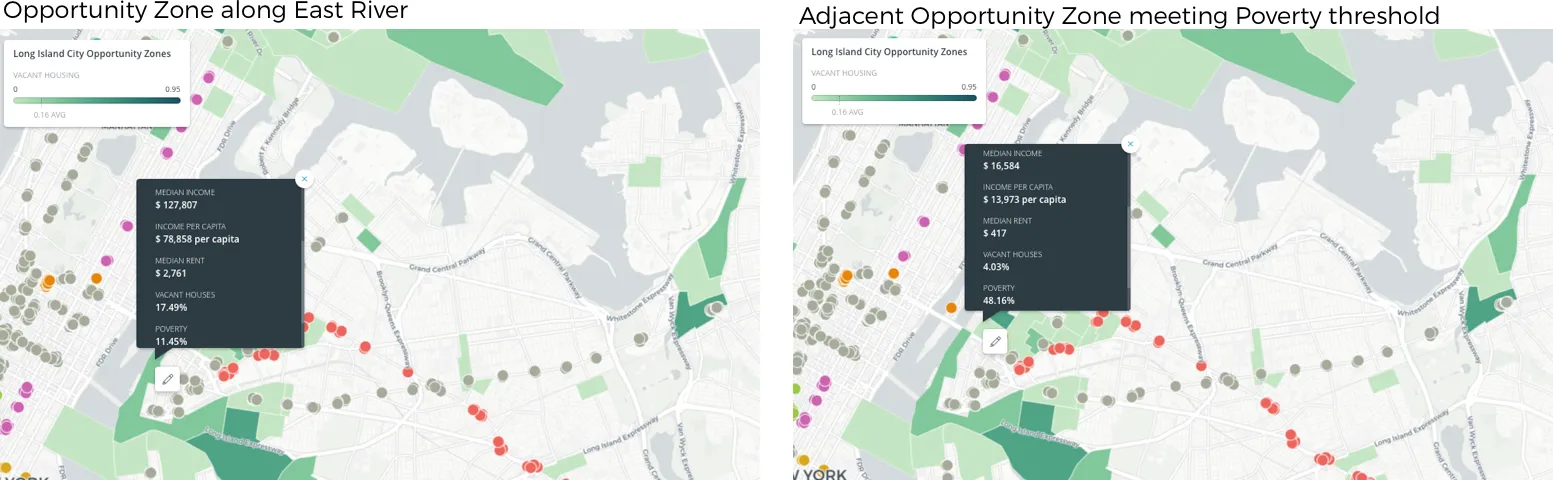
To add insult to injury Amazon will be eligible for significant tax breaks since the Long Island City campus will likely fall within one of the U.S. Treasury Department's newly designated opportunity zones the nearly 8 700 low-income communities (LICs) as well as some adjacent non-LIC census tracts rezoned to spur economic growth through tax incentives for private investors and developers. The map below shows opportunity zones in and around Long Island City and it is expected that Amazon will construct its 400 million square foot HQ2 (or HQ3?) campus along the East River:
Using census data from 2006-2015 the map includes measures for each census tract that was zoned including median income poverty vacant housing and education rates and more. While the opportunity zone along the East River which many predict will house the new headquarters has a household poverty rate below the 15% national average and the 20% threshold needed to qualify for rezoning through the Treasury Department's Opportunity Zone Program the census tract was eligible because of the high poverty rate in the contiguous tract displayed in the picture below:
Amazon's site selection decision is certainly having an effect on our understanding of opportunity zones and in this post we're going to provide some introductory tips for investors developers and most important local communities on evaluating opportunities in these locations. Along the way we'll also highlight some recent maps from our users that explore opportunity zones in terms of accessibility residential and commercial construction projects job growth and environmental factors in other cities across the country.
Missed our recent opportunity zones webinar? Watch it anytime through our on-demand webinar library!Watch it now!
Opportunity Zones 101
The U.S. Department of Treasury and IRS rezoned approximately 8 700 economically distress census tracts as opportunity zones to drive capital into low-come communities (LICs) with tax incentives on capital gains for long-term investments supporting place-based investments.
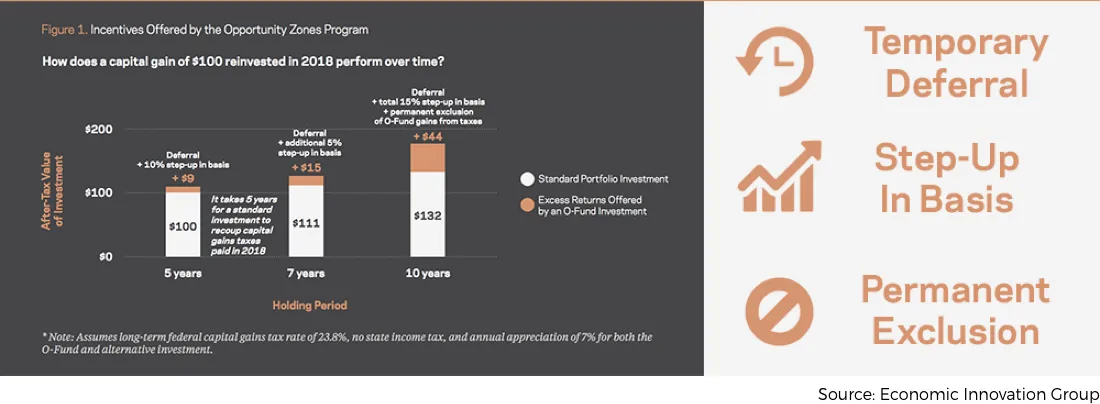
Opportunity Fund stakeholders are rewarded for taking risks and encouraged to make long-term investments as tax benefits are tied to the longevity of the investment. When Funds reinvest the profits of a property sale back into the same opportunity zone they receive capital gains tax breaks that increase after 5 7 and finally 10 years. However to qualify for the 7 year investment benefits (postponement of capital gains taxed until 2026 and a 15% reduction on the deferred gain) investors and developers must finalize purchases by December 31 2019.
This deadline is causing many in real estate to look for new solutions to help survey identify and evaluate potential areas for investment. In determining which of the 31 848 eligible census tracts would become opportunity zones the Treasury Department invited governors to nominate up to 25% of their state's LICs that met a broad set of criteria such as:
- Census tract exhibits a poverty rate of at least 20%
- Census tract displays median family income that is less than 80% of its wider region
The map below shows the final opportunity zones put into effect June 14 2018 and that will retain this designation until December 31 2028.
Behind California (679) and Puerto Rico (861) Texas ranked third for most opportunity zones with a total of 628. The Federal Reserve Bank of Dallas mapped each zone:
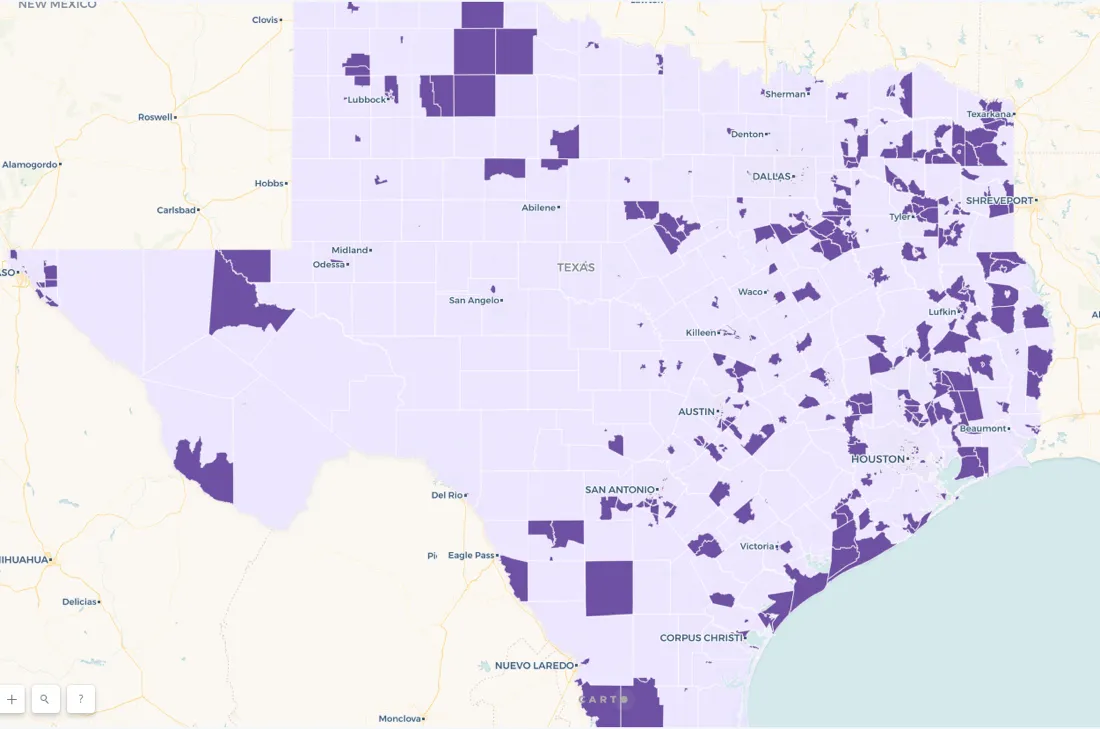
In adding county-level boundaries the Federal Reserve Bank was able to determine that new opportunity zones are overrepresented in rural areas. "While 38% of census tracts across Texas are considered either partially or fully rural " writes Emily Ryder Perlmeter "60% of OZs [opportunity zones] are in at least a partially rural tract." As a result 61% of Texas opportunity zone population lives in partially or fully rural area compared to 40% of state's total population.
The map below shows Texas opportunity zones styled according to total population per square kilometer to get a better sense of this overrepresentation.
There are restrictions on what types of projects are permitted in opportunity zones as well. To ensure that development projects benefit the local communities investors and developers must propose projects that either:
- Bring new business to area with at least 70% of business occurring in said zone
- Expand existing businesses in the area
- Increase local residential and commercial real estate
The map below from one of our users shows opportunity zone building permits styled by zoning group in Philadelphia Pennsylvania:
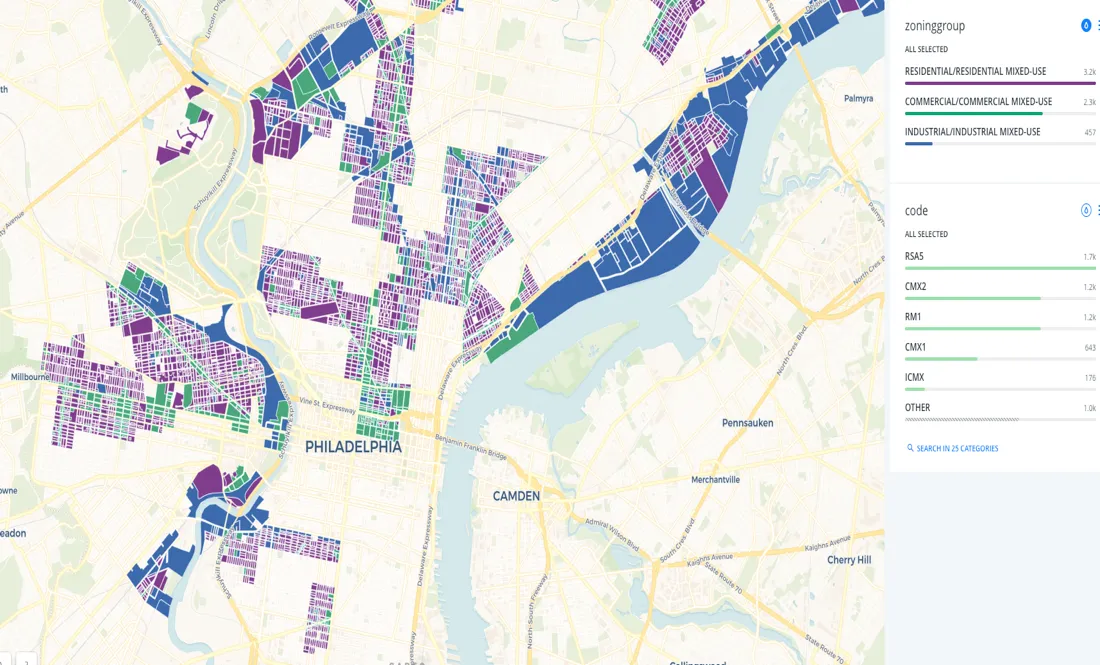
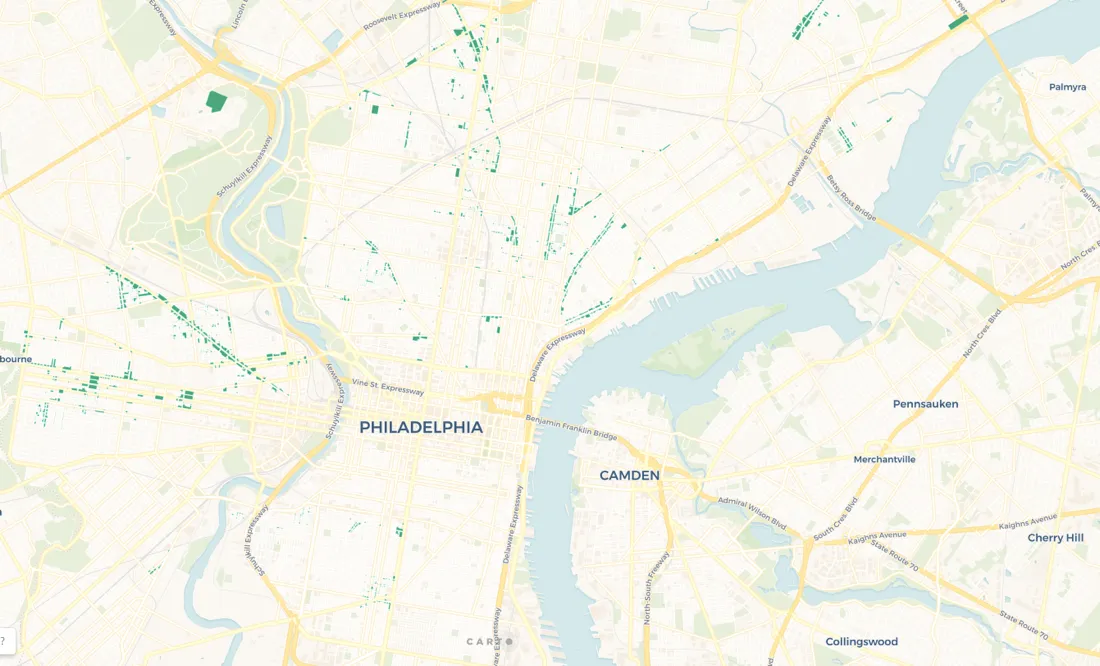
This map displays concentrated pockets of zoning groups across the city providing stakeholders a snapshot of the current economic activity and real estate layout of each opportunity zone and likely that of surrounding areas as well. In addition zone groups can be filtered using Philadelphia's code guidelines as in the map below of current community/commercial mixed use (CMX-3) buildings in each opportunity zone:
There are several exceptions one of which is discussed in the next section but generally speaking the criteria's broad design makes accounting for spatial variance among zones difficult. In order to avoid reinforcing regional or coastal biases stakeholders need access to a large amount of historical location data for each zone and data on the economic health of nearby locations. In short all opportunity zones are not created equal.
Nears things are more related than distant things…
Based solely on income 45% of all U.S. neighborhoods qualified for rezoning a figure that increases to 57% of all neighborhoods when including additional criteria related to contiguous census tracts. One of the most interesting exceptions relates to non-LIC tracts receiving opportunity zone designation if they were (1) contiguous with at least one LIC and (2) had a median family income less than 125% of the median family income of at least one of said contiguous LICs.
Los Angeles has one of the largest contiguous sections of opportunity zones in the country:
One way to start parsing contiguous zones is looking at differences in median rent. The map below looks at the same part of Los Angeles focusing on the higher end of the rent price distribution:
Areas exhibiting high median rents and high levels of poverty can be indicators for socio-demographic changes. Further analysis of these locations can be done with Location Intelligence using methods like Moran's I to establish measure of spatial autocorrelation in each zone in order to determine statistical significance of changes.
More complications arise however when there are cross-state contiguities to consider. The map below shows contiguous zones along the state border of Alabama (blue) and Georgia (green):
Here the difference between one zone or another is significant and results from the different approaches each state adopted when selecting LICs to nominate for rezoning. As the Brookings Institute reports Georgia and Hawaii allocated 80% of nominations to their most distressed areas while other states including Alabama opted to nominate less distressed albeit eligible LICs which contextualizes the different poverty rates between these two zones.
Hyper-targeted investment searches
In adding more context to opportunity zone maps Location Intelligence enables conducting targeted searches for areas meeting select criteria. Smart Growth America has built an Opportunity Zone Navigator allowing users to search zones based on transit environmental economic housing and affordability factors. The map below has been set to search for opportunity zones with Brownfield sites nationwide:
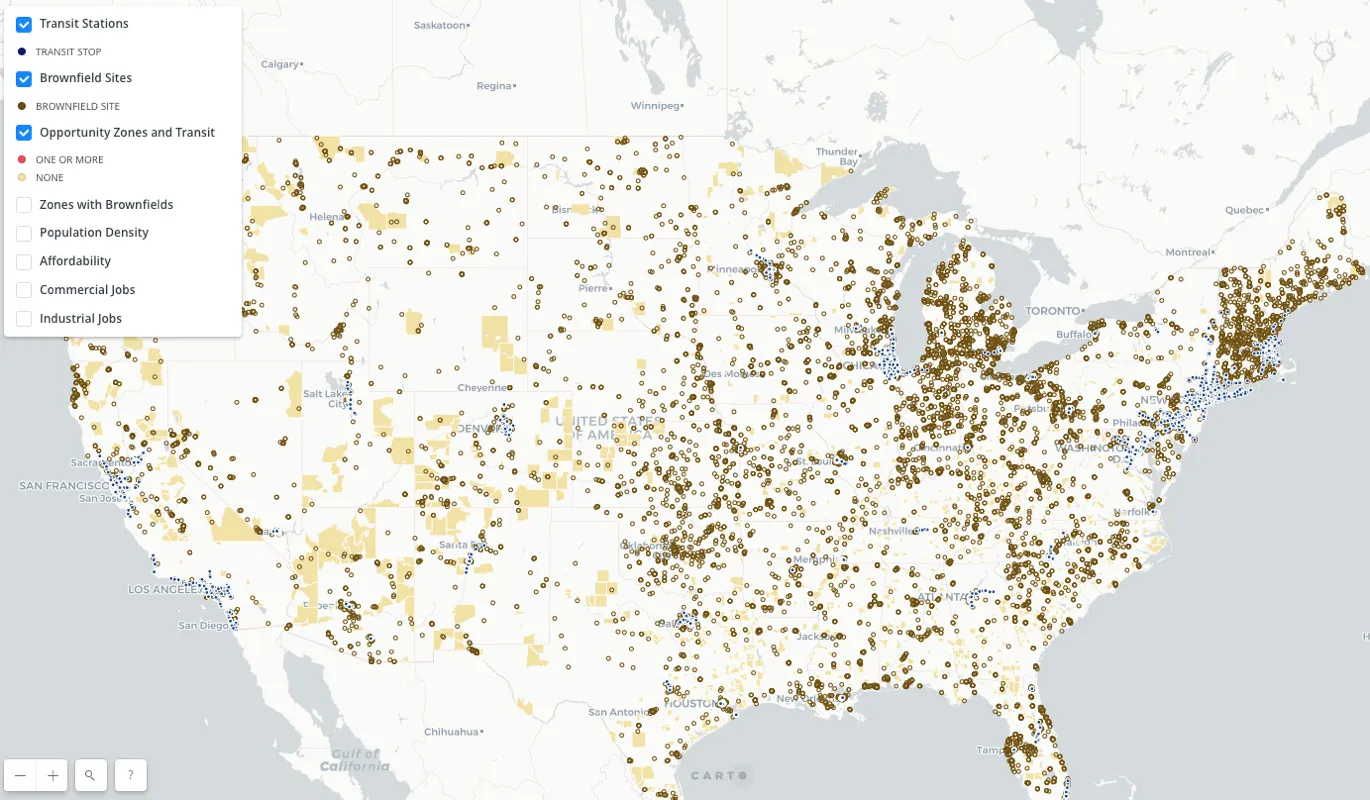
Despite the current administrations attempts to dismantle the EPA earlier this year the EPA's Brownfield Program which provides government assistance and tax breaks to stakeholders involved in the cleanup and redevelopment of Brownfield sites was renewed. Opportunity zones with Brownfield sites are eligible for even more tax breaks for their environmentally-conscious efforts. In the map of Michigan below we see opportunity zones with Brownfield sites and transit stations in Flint and Detroit:
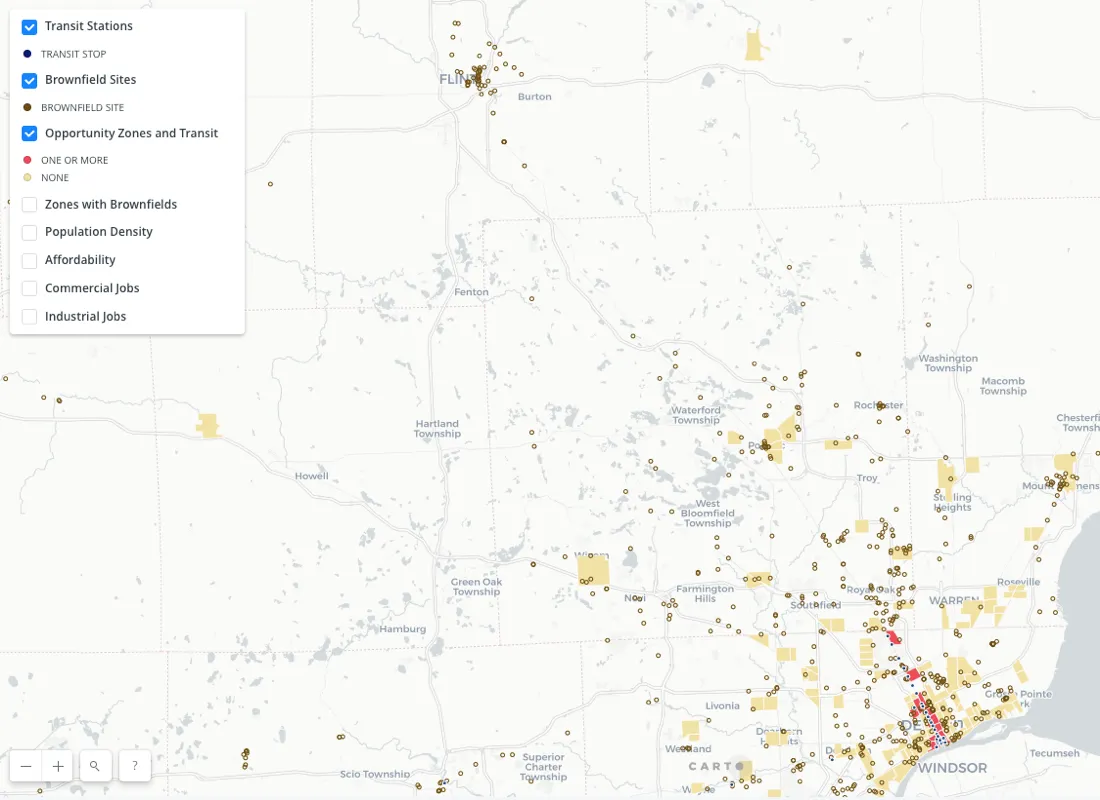
The infrastructural inaccessibility of Flint--from its still contaminated water system to its lack of transit--puts it at greater disadvantage compared to Detroit. As an evaluative measure accessibility is likely to gain even more importance in the coming year as real estate professionals aggressively survey opportunity zones to meet the December 2019 deadline.
Next steps
The major obstacle facing real estate professionals is establishing a comparative framework to account for spatial variance among opportunity zones at the local regional and even national level. Location Intelligence can provide new metrics for assessing place-based investments using location data streams.
We've only scratched the surface when it comes to opportunity zone decision making processes and future posts will present different ways spatial data science can resolve issues related to spatial variance. In the mean time let us know what obstacles and opportunities you've encountered when it comes to evaluating these new areas.
Looking to learn about Location Intelligence for real estate?
Our experts are available to help!