

Measuring the Potential Impact of Amazon HQ2 on DC and Other Candidate Sites


We don’t yet know where it will end up but Amazon HQ2 is going to vastly change the physical societal and economic landscape of the chosen site. For the candidate cities Amazon itself and other local economic interests the impact of HQ2 will be significant. But what insights from Amazon's impact on the city of Seattle Washington can municipal leaders and other local officials consider to anticipate changes if their city is selected by the e-commerce giant?
Using Location Intelligence and multiple data streams we can gain significant insights on the impact of development at a hyper-local level.
The Impact of Amazon In and Around the Seattle Campus
For 10 years following their founding in 1994 Amazon primarily stuck to their initial business model as an online retailer of books. The company grew modestly through the late nineties surviving the dot com bust of the late nineties and early 2000’s.
Amazon as we know it today was formed by major company shifts occurring in 1998 & 2005. First in 1998 Amazon announced its shift away from only selling books. And in 2005 Amazon launched Amazon Prime its premium service guaranteeing 2 day shipping for member orders.
In the below map we can see that prior to 2005 the development around the Amazon HQ in Seattle was quite modest. Only 48 building permits were applied for and the type of construction was mostly uncategorized and scattered around the neighborhoods surrounding amazon.
After 2005 and the announcement of Amazon Prime and in 2006 with the launch of Amazon Elastic Cloud Service (what would become Amazon Web Services) the growth in development skyrockets. From 2005 till 2011 over two thousand permits are applied for and construction of commercial properties (retail and office space) grows dramatically. The green area shows a 15 minute walk time around the Amazon HQ and you can see that in close proximity to the Amazon HQ Commercial development is highly concentrated. Also multi-family residential (condos and apartments) is built at a much higher rate than single family homes in this area perhaps showing that the residential development trends tend to lean more towards multi-family development in the wake of major headquarters growth.
Finally after 2011 Amazon announces Amazon Video and Fire Tablets and becomes the company we know today producing content devices and selling all things retail. The development in the timeframe from 2011 to 2018 is consistent with the previous time period showing that within the 15 minute walk time of Amazon HQ development trends are concentrated in the commercial and multi family home segments.
HQ2: Predicting the Impact
In 2017 Amazon announced the search to find their second headquarters. After much speculation we still don’t know exactly where they will go but we have a good set of highly likely candidate cities. Within these cities specific sites have been identified as potential locations for HQ2. Based on our findings from Seattle we can try to understand the impacts of an Amazon HQ at candidate sites.
One of the top contenders in the search for HQ2 is Washington D.C. and the surrounding suburban area with a rumored candidate site in Bethesda Maryland near the National Institute of Health. This site meets many of the criteria set forth by Amazon (near public transit access to highly educated populous etc…) but how will current residents and development patterns in this area be impacted? Based on what we know from the transformation in Seattle what can we expect in Bethesda?
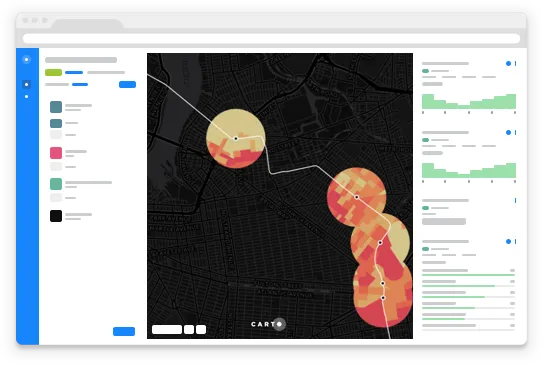
In the below map the area defined around the proposed site represents a 15 minute walk time. Within this area we can explore various metrics to understand the area in which Amazon may build and the subsequent boom in development we might expect based on the Seattle observations. The map shows the development patterns average housing price (from our Data Observatory via Zillow) and a measure of social vulnerability provided by the CDC.
The use of the CDC dataset is key here. Typically this dataset is used in emergency management to identify ‘at risk’ populations in the event of a disaster. For example if a hurricane comes ashore and flooding is likely where are the areas in which evacuation of the population will be challenging and the subsequent destruction of the properties will have a more adverse effect? But this dataset provides some interesting calculations based on multiple variables from census data to calculate risk scores associated with Housing Transportation and socio-economic status. So how does this relate to Amazon HQ and the building of a new campus?
Power your site selection decisions with Location Intelligence! Learn how CARTO can help!
As we saw in Seattle we know that wherever HQ2 is placed we can expect a spike in commercial development (retail and office space) and in multi-family condos and apartments. This spike in real estate development and the rise in prices for housing and leased office space will have an impact on the existing community especially those who are in the ‘higher risk’ categories for housing and transportation. If development of condos and apartments occurs in an area populated by those who depend on disability or other forms of public assistance to afford housing increased housing costs will have a greater impact possibly taking the form of displacement and gentrification. Also rising lease rates for office and retail space will impact local businesses currently operating in the area.
The above map shows census block groups colored from light to dark red based on the aforementioned risk score . As you can see the scores are fairly low in the immediate area of the prospective site. However within the 15 minute walk area where many employees may choose to live the risk scores increase especially to the north of the proposed site. This means that those areas in particular could face adverse impacts from the development of HQ2 in Bethesda.
For local governments this kind of assessment can inform policy decisions mitigate negative impacts and prevent problems like displacement and sharp housing cost increases. Local businesses can use this information to make strategic decisions around marketing to new residents. And Amazon themselves can get a sense of their own impact and work with local communities to address challenges on a neighborhood-by-neighborhood street-by-street level.
Informing Site Planning Decisions and Measuring Their Impact with Location Intelligence
While Amazon's decision remains uncertain what is certain is that new location data streams are modernizing the site planning process. Whether it’s retail performance insights from MasterCard or traffic and mobility figures from TomTom's GPS data site planners can answer site-specific questions beyond "where do I open my next store " with confidence.
Looking to boost your site selection process?
Our experts are available to help you unlock new insights with Location Intelligence and modern data streams.


