What's New in CARTO - Q1 2022


During the first quarter of 2022 we released some exciting new features and enhancements to the CARTO platform giving users unparalleled spatial analysis capabilities natively in the cloud.
Since the launch of the new CARTO platform in Q4 2021 we have been laser-focused on evolving both functionality and user experience to make it the leading cloud native Location Intelligence platform available.
Data scientists analysts and business users now have access to a ground-up cloud native development to better solve spatial problems predict future outcomes and optimize their business decisions. And all of this happens without data leaving their own cloud data warehouse infrastructure be that Google BigQuery Snowflake Redshift or Databricks.
This past quarter we have launched a number of important features across all components of the platform - from Builder our drag and drop tool to build and publish interactive maps to our Analytics Toolbox that unlocks advanced geospatial analysis natively in the major cloud data warehouse platforms. We have also continued to enhance our tools for web developers building Location Intelligence applications.
In this post we cover some of the major product milestones achieved during the first three months of 2022 so you can share in the exciting momentum we have whilst building out our product. Let’s take a look!
Feature Selection Tool Improved Legends and Export Capabilities for Better Interactive Maps in Builder
To help users generate quicker spatial insights this last quarter we added a new feature selection tool in Builder. This now lets our users apply a mask to the map using polygons or custom shapes to filter the data that is rendered on the map and represented in the interactive widgets.

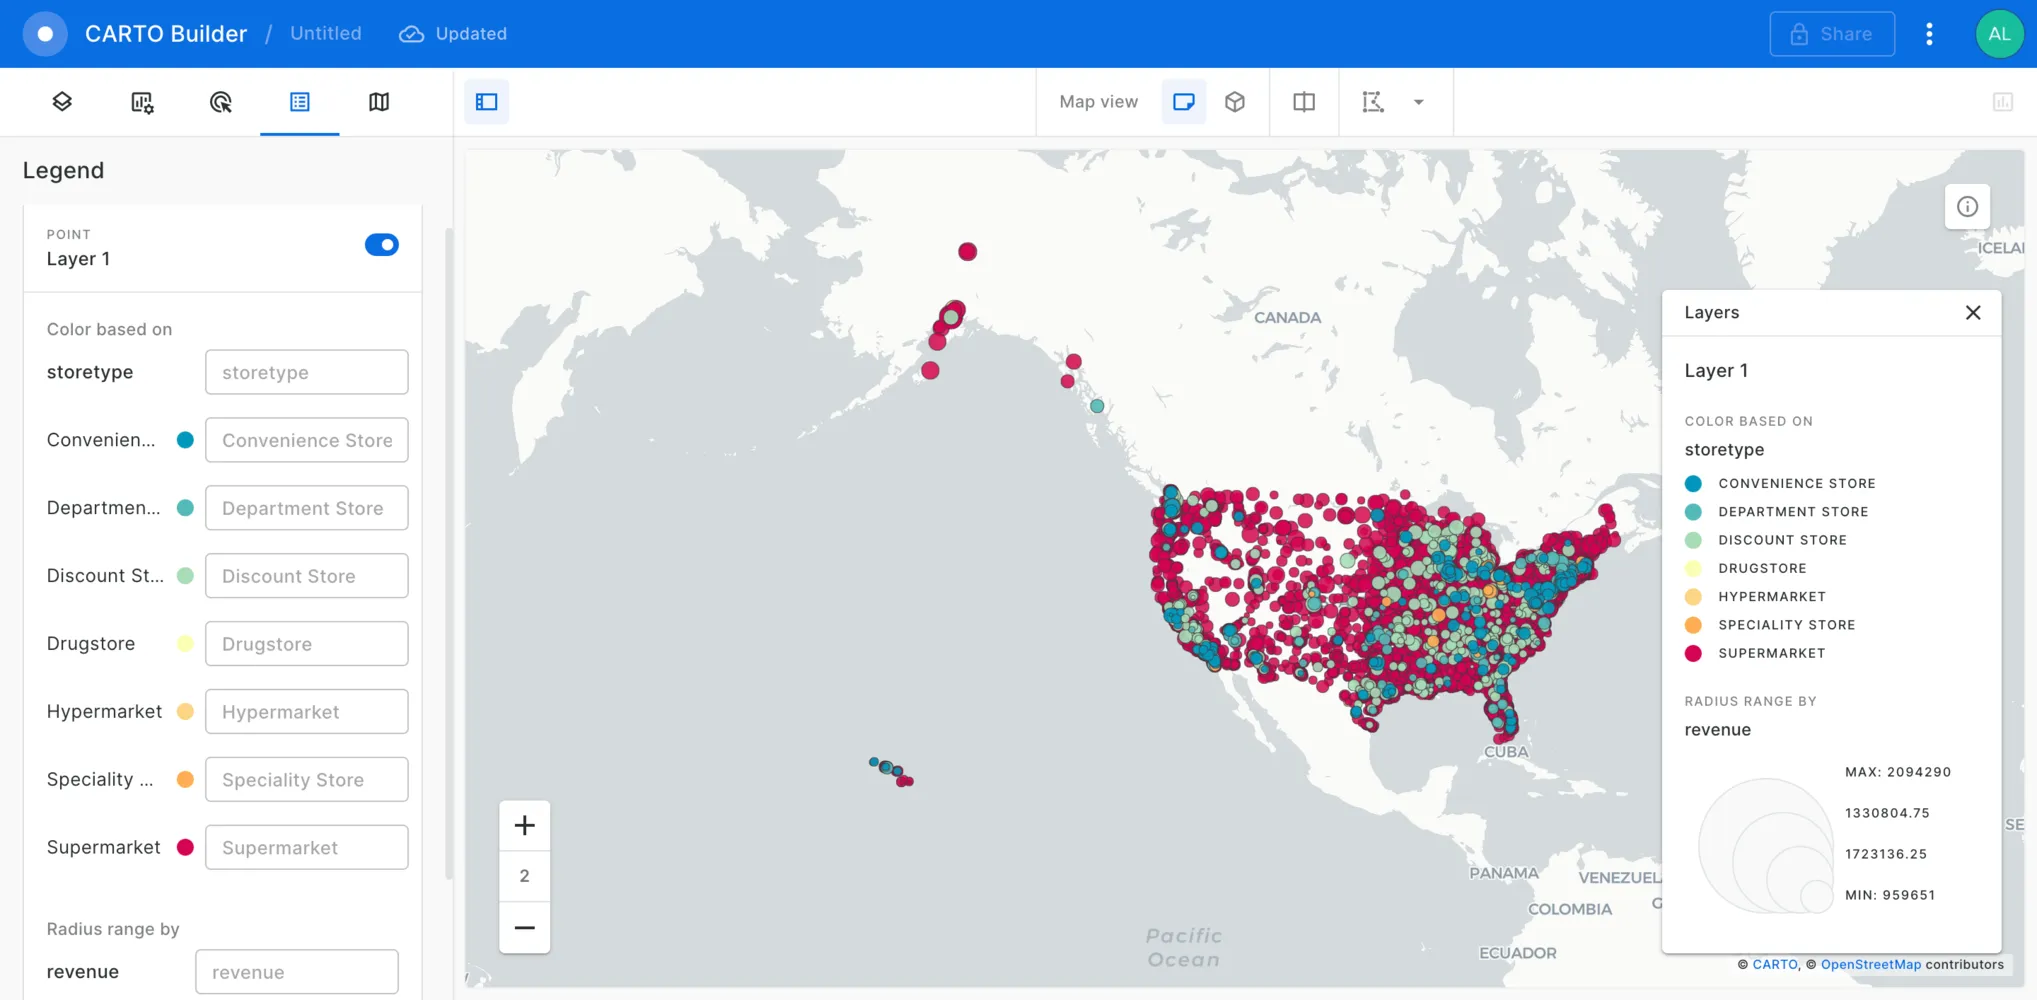
We have also improved the data representation capabilities in our legends so that your data visualizations on maps are much easier to understand. We have added a new layer selector so users can now control the data layers they are visualizing at any time.
Maps are incredible tools for analyzing data and quickly generating insights thanks to the geographical context and their powerful data visualization capabilities. However we know that some CARTO users need to continue their analysis using other tools or share analysis results with internal and external stakeholders outside our platform. For this reason we have enabled the functionality to export data represented in the map viewport as a CSV file.
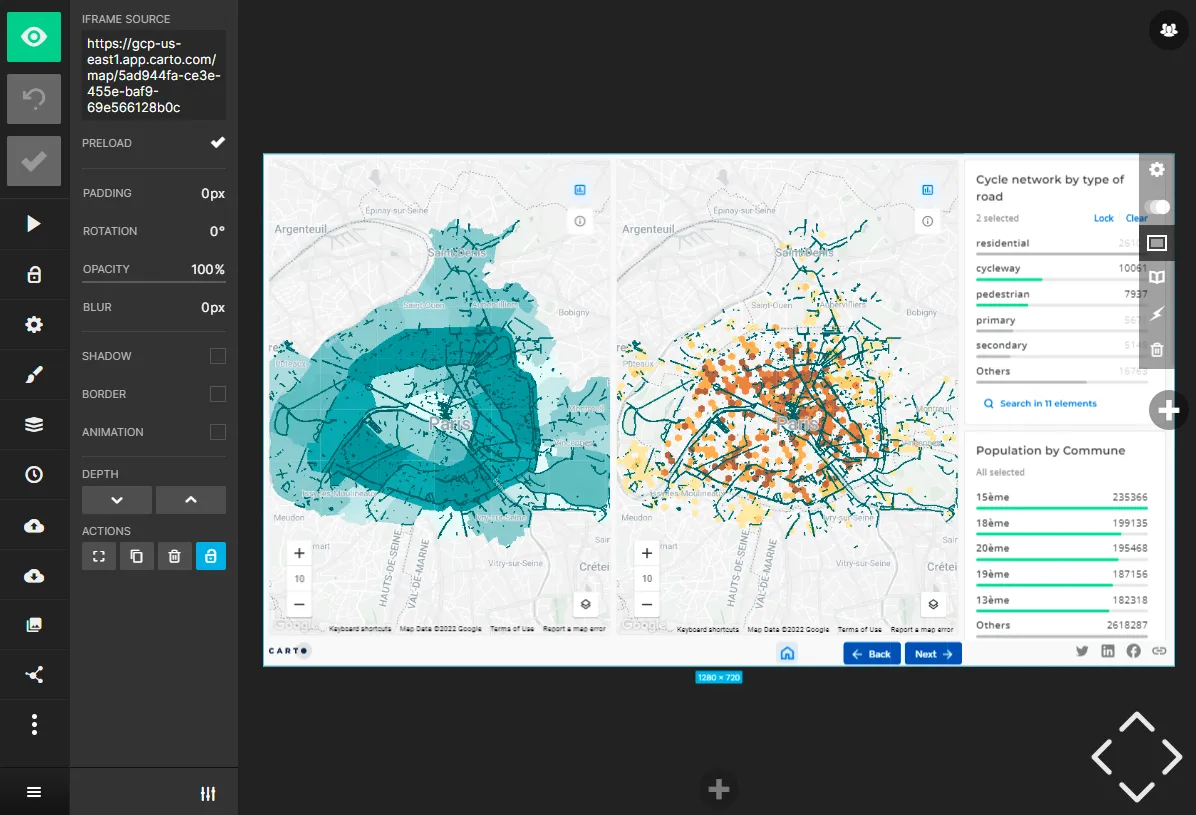
Finally our Embed API lets users dynamically configure and control maps via URL parameters; which is especially useful when embedding CARTO maps into applications or building story maps with the new generation of no-code tools.
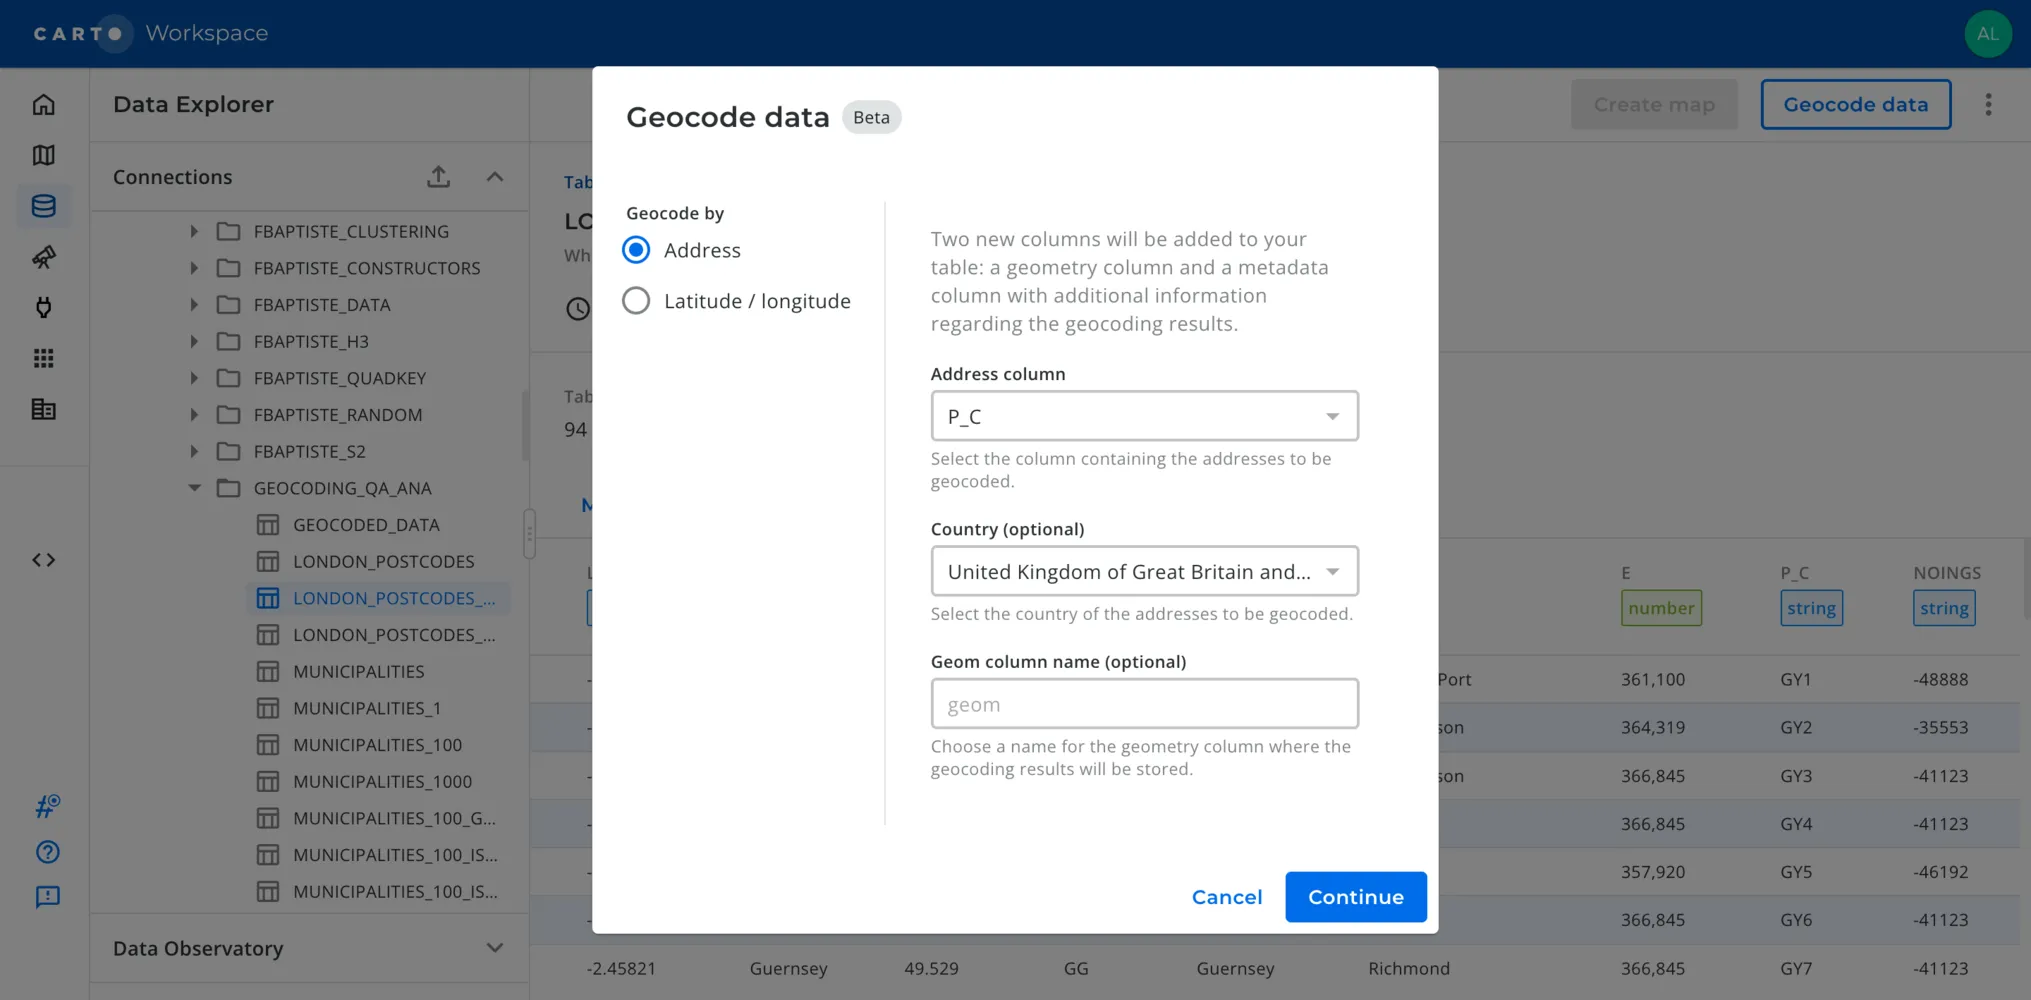
Geocode Data and Import More Geospatial File Formats into Your Data Warehouse via the Data Explorer
One of the major product enhancements that took place within the last quarter was the first release of the Location Data Services (LDS) procedures that run natively in cloud data warehouse platforms. Now users can access geocoding and isolines services without having to move data out of their cloud platforms simplifying workloads significantly. Check out the details on how to run these procedures in our documentation for both the Analytics Toolbox for Snowflake and the Analytics Toolbox for Redshift. In upcoming quarters we will be releasing this same functionality for other data warehouse platforms.
Additionally geocoding is now also available directly from the Data Explorer interface for those tables that do not have a geometry column. Address level geocoding is currently available for tables via Snowflake and Redshift connections; moreover converting latitude and longitude data into point geometries is also available for BigQuery connections.
We know our users currently have spatial data in multiple formats and we don’t want that to be a blocker for them to leverage the power of CARTO so we have increased our coverage for importing geospatial files formats with support for KML KMZ Geopackage and TAB.
Visualize Massive Spatial Datasets Directly from Snowflake and Redshift
Similar to what we delivered last year with our BigQuery Tiler; now users who need to handle millions of geographic points or massive geospatial datasets in Snowflake or Redshift can build stunning visualizations without having to move data outside of these platforms. This leverages our simple SQL methods for creating vector tilesets (a representation of the data optimized for map visualization). Within the documentation for the Analytics Toolbox for Snowflake and the Analytics Toolbox for Redshift you can find detailed information on how to generate tilesets on these two platforms. During the second quarter of the year we will work on releasing tilers for both Databricks and PostgreSQL databases.
Unlock the Power of Spatial SQL for Retail Analytics with New Functions and Stored Procedures
Our Analytics Toolbox for BigQuery has been further enhanced with a new set of retail-specific functions including revenue prediction white space analysis commercial hotspots and twin areas analysis to allow data scientists working on retail analytics to benefit from the scalability of Spatial SQL. Thanks to our ready-to-use collection of UDFs and store procedures that run within the cloud data warehouse environment users can carry out advanced spatial analytics quickly and easily.
Speed Up App Development by Prototyping Map Layers in Builder. Create Stunning Apps with the Latest Releases of CARTO for Deck.gl 8.7 and CARTO for React 1.2
This last quarter we also released new versions of CARTO for deck.gl 8.7 and CARTO for React 1.2 aimed at web developers who are building spatial apps. As a highlight with the new fetchMap function developers can now easily instantiate layers configured in Builder for their use with deck.gl at the time of building their applications with just a single line of code; you can see an example here.
A More Flexible and Secure Deployment Option Using CARTO Self Hosted with Kubernetes
To give CARTO customers the most secure convenient and scalable cloud native solution we have partnered with VMware the leading provider of cross cloud services. Supported by their market-leading knowledge and technical expertise we have recently launched the Kubernetes self-hosted version of the CARTO platform. This new deployment method meets the most rigorous security requirements and brings data governance flexibility and scalability benefits for customers working on large scale spatial analytics use cases in the cloud.
CARTO Self Hosted runs perfectly in all managed Kubernetes from the major cloud providers: AWS EKS GCP GKE and Azure’s AKS. Even in AWS GovCloud for government use cases. It can also be deployed in your own Virtual Private Cloud making it even easier to control and monitor network access.
In addition we offer CARTO Self-Hosted with Docker which is an on-premise solution aimed at smaller-scale cloud deployments.

We are really excited by this wave of enhancements to the CARTO platform and would like to thank our customers and partners for guiding this evolution. Look out for regular updates on future releases and subscribe to our blog for the latest CARTO news. If you would like to try out these features for yourself then sign up for our free 14-day trial.