Raster vs Vector Maps: What's the Difference & Which are Best?


Raster is faster but vector is corrector!
Ever debated between raster vs vector data for visualizing spatial layers? Besides linguistic imperfections, is vector truly superior?
In this post we take a look at the key differences between these two types of spatial data and discuss when it is more appropriate to use one or the other. First though, let's define exactly what we mean when referring to spatial data as either raster or vector.
Raster Data
Raster data is made up as a matrix of pixels, also referred to as cells, in much the same way as you might find when working within a spreadsheet. They are often square and regularly spaced but don't have to be. Think of walking over a field divided into a grid of squares with each square representing a value which can be discrete (e.g. soil type) or continuous (e.g. elevation).
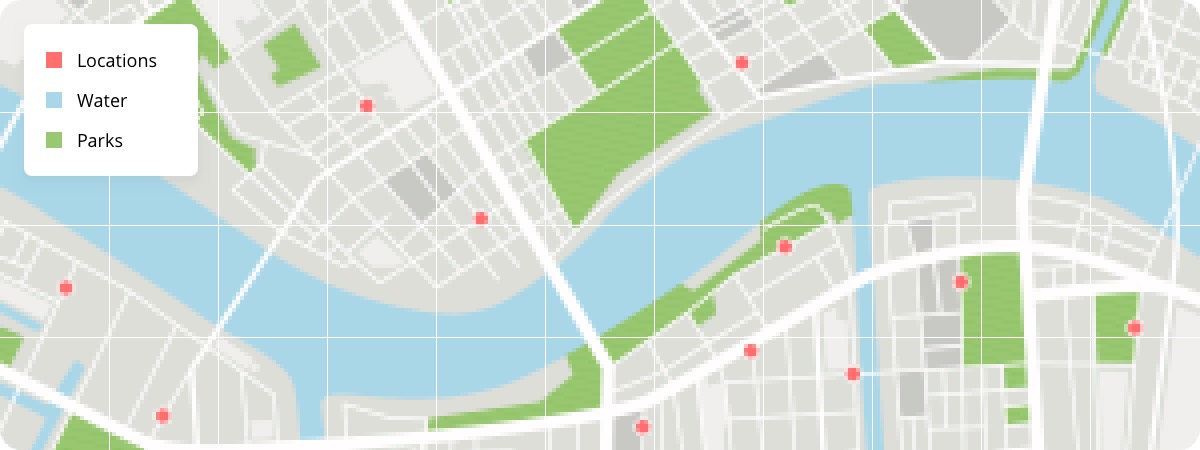
Check out the map below for an example - can you see how it looks slightly pixelated? That's because the spatial features are in fact rendered as pixels!
Vector Data
Rather than working with a matrix of cells, vector data stores basic geometries (made up of one or more interconnected vertices), with three key types:
- Points - single vertex, e.g. a house.
- Lines - two or more vertices where the first and last vertex are not equal, e.g. a road.
- Polygons - three or more vertices with the last vertex equal to the first, e.g. a boundary.
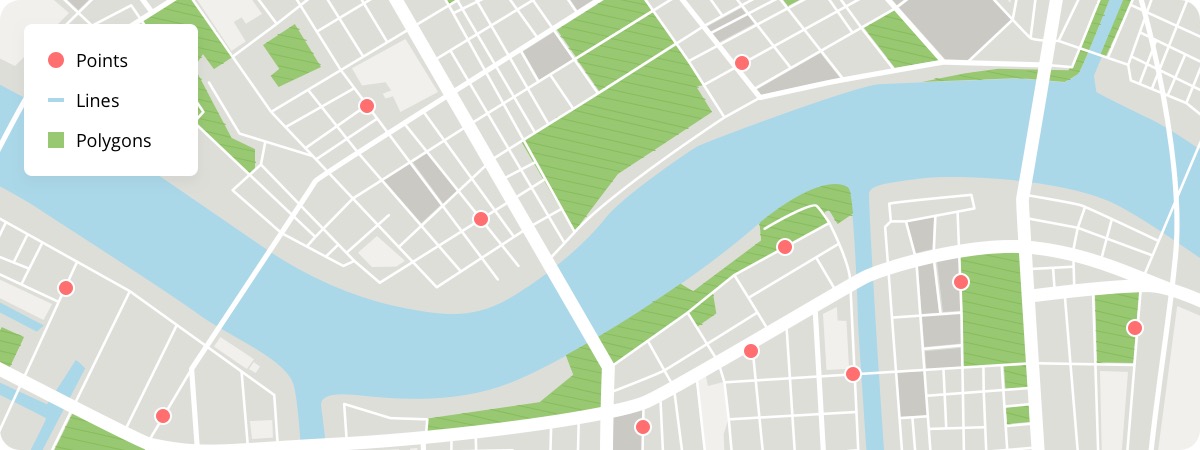
Below we can see vector data being used to convey building heights across New York City (open in full screen here) - notice how every building is a distinct feature.
%20(2).webp)
Want to try for yourself? Sign up for a free 14-day CARTO trial!
Advantages & Disadvantages
| Advantages | Disadvantages | |
|---|---|---|
| Raster | Map Algebra with raster data is usually quick and easy to perform Some specific use cases can only be achieved with raster data (e.g. modeling water flow over the land surface) | Linear features and paths are difficult to display Subject to a pixelated look and feel Datasets can become very large because they record values for each cell |
| Vector | Graphical output is generally more aesthetically-pleasing Higher geographic accuracy because data isn’t dependent on grid size | Continuous data is poorly stored and displayed Needs a lot of work and maintenance to ensure that it is accurate and reliable |
Use Cases
When working with raster or vector data within the sphere of spatial analysis there are of course a myriad of use cases that can be employed but - as has been touched upon already - there are specific cases where it can make sense to use one over another.
For example due to the nature of its collection raster is often the only choice when working with remote sensing data captured by cameras on planes or satellites. The spatial resolution of such data will be determined by the capabilities of the sensor used to take an image which is why it can be subject to a pixelated look when using a low resolution.
For example, the map below visualises flood risk in Cardiff, Wales. Flood risk can be seen as a "continuous" spatial phenomenon - i.e. two contiguous cells are likely to experience very similar flood risk - making raster an ideal format for this data. Learn more about how this map was created and CARTO's support for raster data in BigQuery here.
.webp)
Vector data is more appropriate for analysing discrete spatial features - such the building you're standing in, or the road you've just walked along. Some Spatial Data Science questions that can be answered leveraging vector data include:
- What is the relationship between credit card transactions and social media data?
- From which cities do we see the highest demand for our products?
- Where is the optimal curbside location?
- How can I optimize my supply chain?
Which is Best?
As we've seen there are distinct use cases for using either raster or vector data. Many will make impassioned arguments extolling the virtues of one or the other but thankfully since raster can be converted to vector and vice versa there is no need to commit exclusively. There is even a new generation of data which features some of the best characteristics of both data types.
Spatial Indexes
Note: This section of the blog has been updated in January 2023.
Spatial Indexes are global grids - in that sense, they are a lot like raster data. However, they render a lot like vector data; each "cell" in the grid is an individual feature which acts more like a polygon. They can be used for both vector-based analysis (like running intersections and spatial joins) and raster-based analysis (like slope or hotspot analysis).
But where they really excel is in their size, and subsequent processing and analysis speeds. Spatial Indexes are "geolocated" through a reference string, not a long geometry description (like vector data). This makes them small, and quick. So many organizations are now taking advantage of Spatial Indexes to enable performant analysis of truly big spatial data. Find out more about these in our ebook Spatial Indexes 101.