What is Supply Chain Network Design and How Does It Work?


Did you know that 90% of a company’s environmental impact comes from its supply chain? This means that an optimized supply chain is about more than just good business.
Whether you’re selecting the ideal location for a new distribution center, reducing last mile delivery costs or ensuring sustainability compliance, managing every aspect of supply chain design is tied to location analytics.
In this post we will explore how organizations are using spatial analysis to build an optimized supply chain which is cost effective, resilient and sustainable - all whilst meeting the needs of your customers.
4 examples of how spatial analysis can optimize your supply chain
1. Distribution Center Placement
Strategic placement of distribution centers can significantly impact your supply chain's efficiency. By using spatial analysis, you can identify the best locations for distribution centers, reducing travel distances, cutting costs, and improving service delivery.
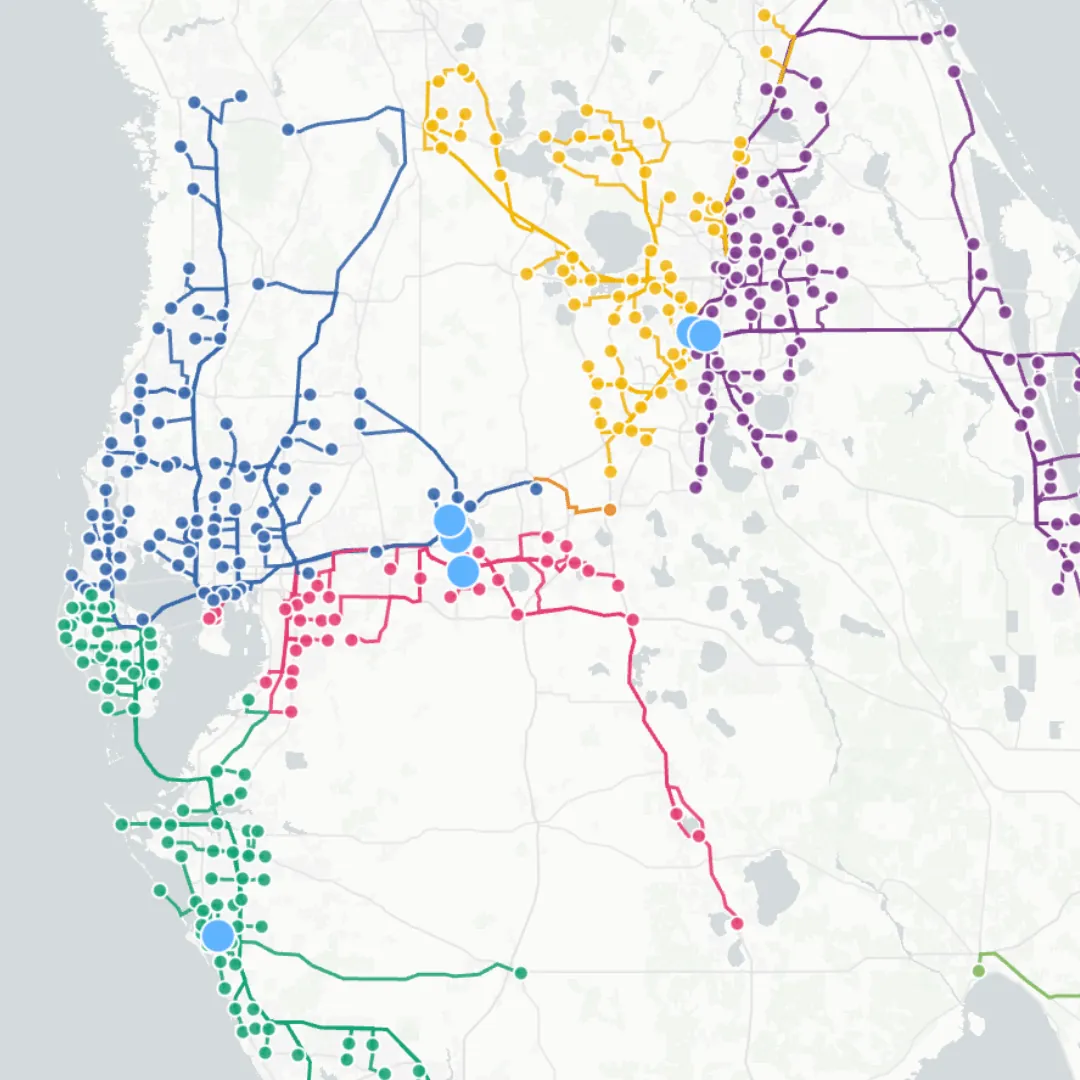
Let’s explore an example of Publix - a grocery store chain. We used CARTO’s no-code route optimization functionality to analyze their supply chain in Florida. By calculating the routes for each of the 421 stores to their nearest distribution center, we discovered several key insights:
- Traveling long distances: Publix’s fleet would travel 32,430 miles each time all stores are restocked. Reducing this travel distance can lower costs, improve efficiency, and decrease carbon emissions.
- Over-Reliance: Two-thirds of Publix stores depend on just three out of seven distribution centers, creating a risk of over-reliance, especially during extreme weather events or infrastructure failure.
- Distance Concentration: 29% of the total distance traveled is attributed to a single distribution center, the Publix Lakeland Dispatch. This indicates an opportunity to better balance the load across distribution centers.
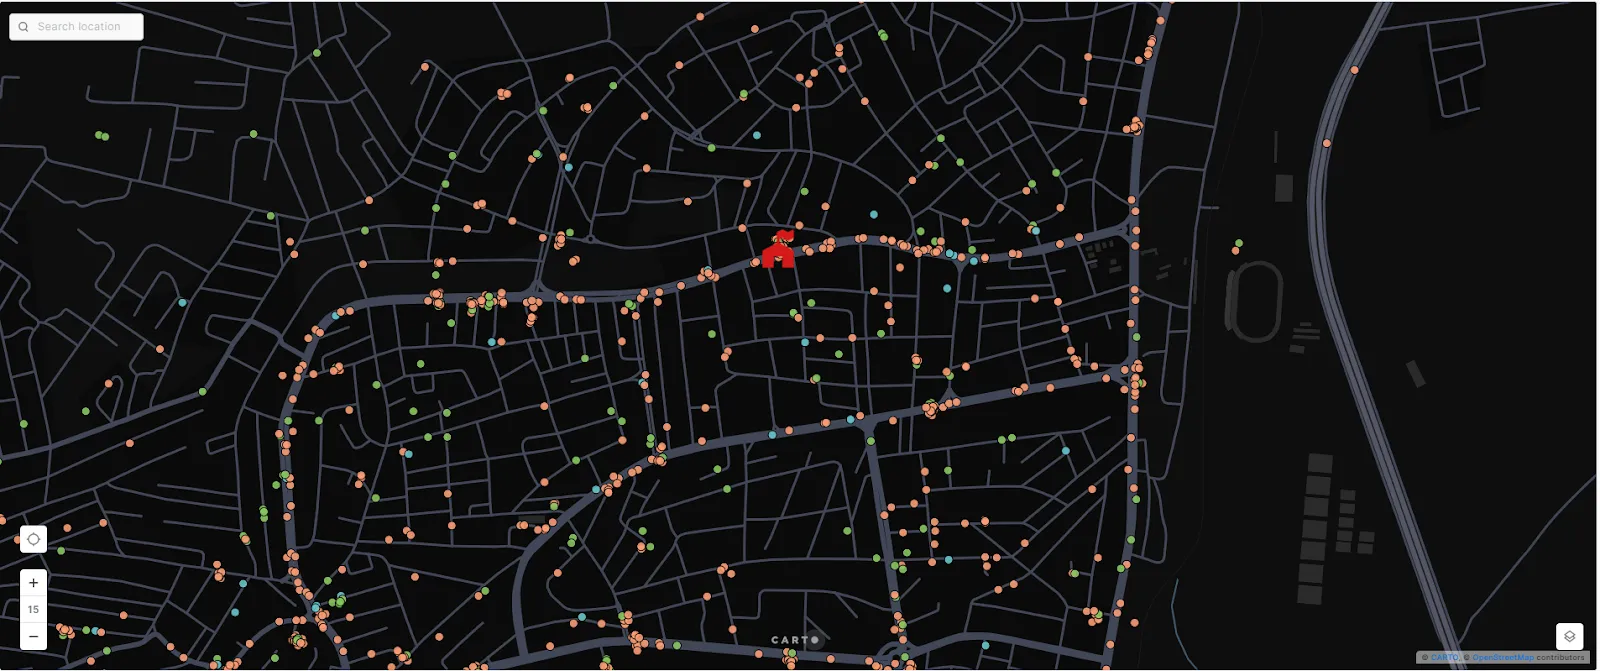
Explore this analysis in the map below (open in full screen here). Looking for an easier way to conduct route optimization? Sign up for a free 14-day CARTO trial and get started today!
So, how could this network be optimized?
We found the “ideal” locations for eight distribution centers using the ST Cluster K-Means clustering technique. This technique groups stores into clusters based on their geographic locations, identifying the central point of each cluster as the optimal location. With the ideal distribution center locations identified, we re-ran the routing analysis.
You can compare this “ideal world” scenario with the original analysis in the map below (existing scenario on the left, optimized scenario on the right - open in full screen here).
Want to craft your own visualizations like this? Head to the CARTO Academy for a huge range of data analysis & visualization tutorials.
.webp)
What does this analysis tell us?
- Distance Savings: the optimized network could reduce travel distance by 12,000 miles every time the stores are restocked. This would provide serious cost savings whilst reducing the organization’s carbon footprint.
- Balanced Distribution: this approach would also lessen dependence on a few key distribution centers.
However, this is reality, not an “ideal world” model. So, how could Publix use this information?
Let’s imagine they have the budget to relocate one distribution center. Our model indicates that adding a new distribution center to the north-west of Tampa could significantly address the long-distance travel and over-reliance issues which their current supply chain faces.
2. Last mile delivery analytics
Did you know the last mile (i.e. the final delivery step to the individual customer) typically accounts for 41-53% of overall supply chain costs? Aramex - a leading global provider of comprehensive logistics and transportation solutions - is tackling this challenge by leveraging advanced spatial analytics to optimize their last-mile delivery operations.
They use CARTO’s advanced spatial analysis capabilities to:
- Optimize Route Planning: identifying the most efficient delivery routes in order to travel time and operational costs.
- Determine Ideal Dark Store Locations: pinpointing the optimal locations for dark stores - i.e. facilities dedicated to fulfilling online orders - by analyzing customer density and demand patterns.
- Enhance Decision-Making: Using CARTO Workflows, Aramex can make informed decisions on site selection, driving networks, and creating isochrones for better last-mile operations.
Read Aramex’s story here.
3. Enhancing supply chain resilience
Resilience in supply chains is critical, especially in areas prone to natural disasters or climate-related risks. Spatial analysis can help assess and mitigate risks by identifying vulnerable points in the supply chain and developing strategies to address them.
Explore the map below to see this in action (open in full screen here)!
.webp)
In this visualization, you can explore how the world’s top 50 ports - and the goods they transport - can be at risk from hurricane activity. Try using the parameters (right-hand side of the map) to determine which hurricanes are included in this analysis, and watch the map update automatically!
4. Driving Sustainability Compliance
Spatial analysis can play a crucial role in ensuring supply chain sustainability. It can provide a cost-effective means for organizations to assess and optimize their operations to minimize negative environmental and social impact. Examples of this in action include:
- Identifying network inefficiencies: by pinpointing inefficiencies such as excessive travel distances or over-reliance on certain distribution centers, which contribute to higher carbon emissions - as we explored earlier in this post.
- Benchmarking and reporting: organizations can use spatial analysis to benchmark their sustainability performance against industry standards and generate reports that align with frameworks like the SEC Climate Disclosure Rule or the Science-Based Targets Network (SBTN).
- Ensuring compliance: for instance, CARTO’s solution for EU Deforestation Regulation (EUDR) compliance leverages spatial analytics to help organizations verify that their supply chains are free from deforestation. The solution enables seamless integration with existing cloud systems, enhanced data governance, and the ability to conduct large-scale sustainability analysis while ensuring regulatory compliance. Learn more here.
.gif)
Supply Chain Network Design: getting started
Optimizing your supply chain network isn't just about cutting costs - it's about creating a system that's efficient, resilient, and sustainable. By leveraging spatial analysis, you can make data-driven decisions that lead to significant improvements in your supply chain operations.
We hope this article has given you some inspiration on how to use spatial analysis to design a more efficient, resilient and environmentally-friendly supply chain. Discover how CARTO can help you achieve this by requesting a demo with one of our experts.