

Distance-based functions for the spatial analysis of point data in BigQuery


Following our recent blogpost describing the availability of the Geographically Weighted Regression method to estimate local spatial relationships, we have now incorporated support for a set of new Spatial SQL functions to analyze the spatial patterns of point-based data in our Analytics Toolbox for BigQuery.
Although leading data warehouses already offer some level of support for spatial data they lack some of the advanced analytical capabilities required for many geospatial use cases. CARTO Analytics Toolbox extends the geospatial capabilities of the most popular cloud data warehouses using spatial SQL with more than 60 advanced spatial functions. Please refer to our product documentation to learn about the different functions that we have in the Analytics Toolbox for BigQuery Snowflake Redshift and Databricks.
Point-based data describes distinct locations in space such as Points of Interest (POIs), like grocery stores, restaurants, offices, hospitals, etc. Often when dealing with point data a preliminary analysis looking at the relationships between these locations is needed.
In this blog post we introduce three new functions for the analysis of point data that are now available in our Analytics Toolbox for BigQuery: the k-nearest neighbors function to find the k-nearest neighbors of each point amongst a set of point data; the Local Outlier Factor function to identify spatial outliers; and finally the G-function to inspect the spatial distribution of point data.
K-nearest neighbors
When working with Points of Interest data as we described in this blogpost we might want to find for example the closest 10 restaurants to each Starbucks in Houston. As showcased in the example that follows, in which we used some POI data from our data partner SafeGraph we can do so by using the k-nearest neighbors (KNN) function:
SELECT a.*  b.city  b.brands
FROM UNNEST((
   SELECT  `carto-un`.statistics.KNN(ARRAY_AGG( STRUCT( geoid, geom)) 10)
   FROM cartobq.docs.safegraph_restaurants_houston)) a
JOIN cartobq.docs.safegraph_restaurants_houston b
ON a.geoid = b.geoid
WHERE brands = 'Starbucks'
ORDER BY geoid
where the table cartobq.docs.safegraph_restaurants_houston stores the locations and brands of all Starbucks in Houston from Safegraph.
These are the results on a map:
Local Outlier Factor
The k-nearest neighbors function can also be leveraged to spot spatial outliers by computing an index called the Local Outlier Factor (LOF). The LOF is computed by comparing the local density of each point to the local density of its k-neighbors where the local density is estimated by the typical distance at which a point can be reached from its k-neighbors.
Taking into account a sample of POIs for the Houston area, we can compute the LOF for each data point using the Local Outlier Factor (LOF) function in the Analytics Toolbox:
SELECT a.*,
b.geom,  b.brands,  b.top_category,
FROM UNNEST((
SELECT `carto-un`.statistics.LOF(ARRAY_AGG( STRUCT( geoid,   geom)) 100)
FROM cartobq.docs.safegraph_sample_houston)) a
JOIN cartobq.docs.safegraph_sample_houston b
ON a.geoid = b.geoid
where for each point stored in the cartobq.docs.safegraph_sample_houston table the local density is computed considering the nearest k=100 neighbors. Although in the query above we joined the results of the LOF function with the input table to retrieve the LOF score for each POI together with its brand and category we could have used the LOF_TABLE procedure instead which automatically stores the result in an output table along with the other input columns.
As we can see from the map below, assuming that points with a LOF factor larger than 10 (>>1) are spatial outliers, we detect a point whose postal code does not belong to the Huston area:
G-function
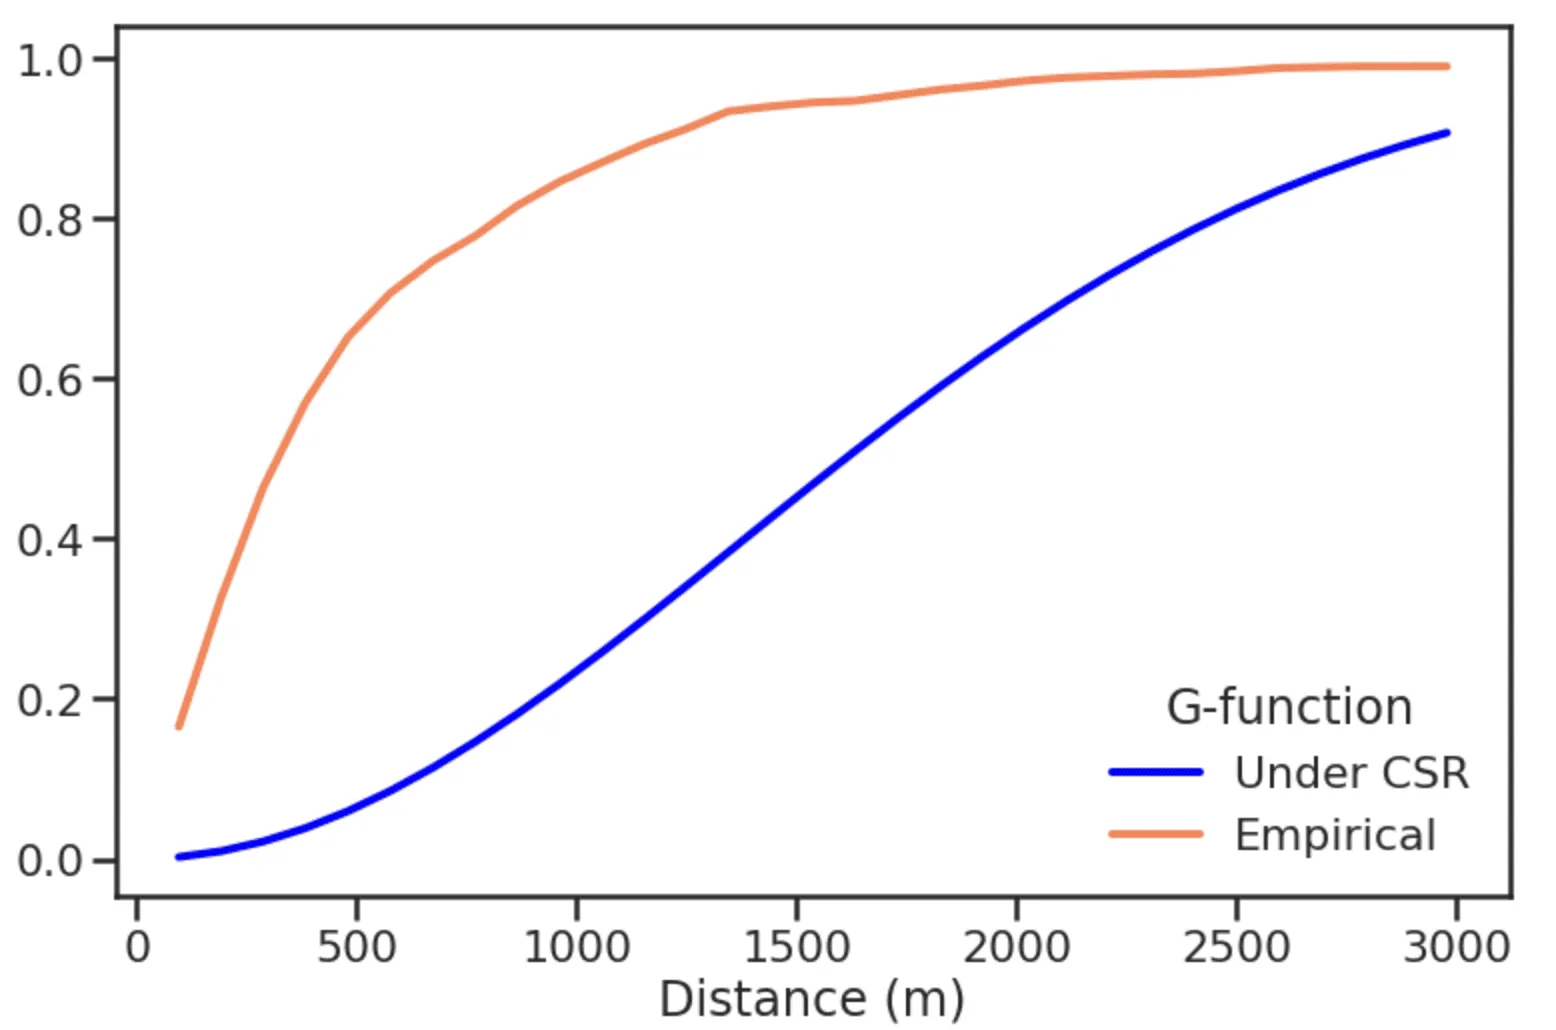
Finally, a distance-based analysis can also be applied to point data to determine if there is a tendency of the locations of the data to exhibit a systematic pattern over an area as opposed to being randomly distributed. For this purpose we can compute the G-function (GFUN) which represents the cumulative frequency distribution (CDF) of the 1-order nearest neighbor distances.
We can determine if the locations are randomly distributed by comparing this empirical G-function to its expected value under the hypothesis that the data points are distributed randomly (Complete Spatial Randomness CSR) which can be estimated as the CDF of an homogeneous Poisson point process of intensity

computed as the total number of points data divided by the area of the study region. Values
suggest a random pattern, while values

indicate a clustered pattern (the nearest neighbour distances are shorter than for a Poisson process) and values
a regular (inhibited) pattern where points tend to avoid each other.
By computing the G-function for the sample POIs dataset in the Huston area
SELECT * FROM
UNNEST((
SELECT
`carto-un`.statistics.GFUN(ARRAY_AGG(geom))
FROM cartobq.docs.safegraph_sample_houston))
and plotting the results we can see that their locations are clustered suggesting that the location of a POI is not independent from the others:
Enhance your spatial analysis in SQL with CARTO Analytics Toolbox
As of today, the KNN LOF and G-function methods are available in our Spatial Extension for BigQuery. We will be announcing further cloud native developments in the coming weeks so stay tuned for regular updates from us!


