Interactive School District Maps & Analysis with WXY


Recently WXY an architecture urban design and planning firm was tasked with analyzing 200+ school boundaries within Montgomery County Public Schools (MCPS). As a part of that analysis they wanted to create the MCPS Interactive Boundary Explorer (IBE) to provide the community with the opportunity to interact with the data being analyzed and add their voice to the process.
To do so WXY leveraged CARTO to visualize their analysis creating an interactive tool that allows users to engage directly with the data.
On the IBE residents of Montgomery can explore the data first hand understand the context of MCPS’s analysis and share feedback or suggestions using the online survey feature.
How it Works
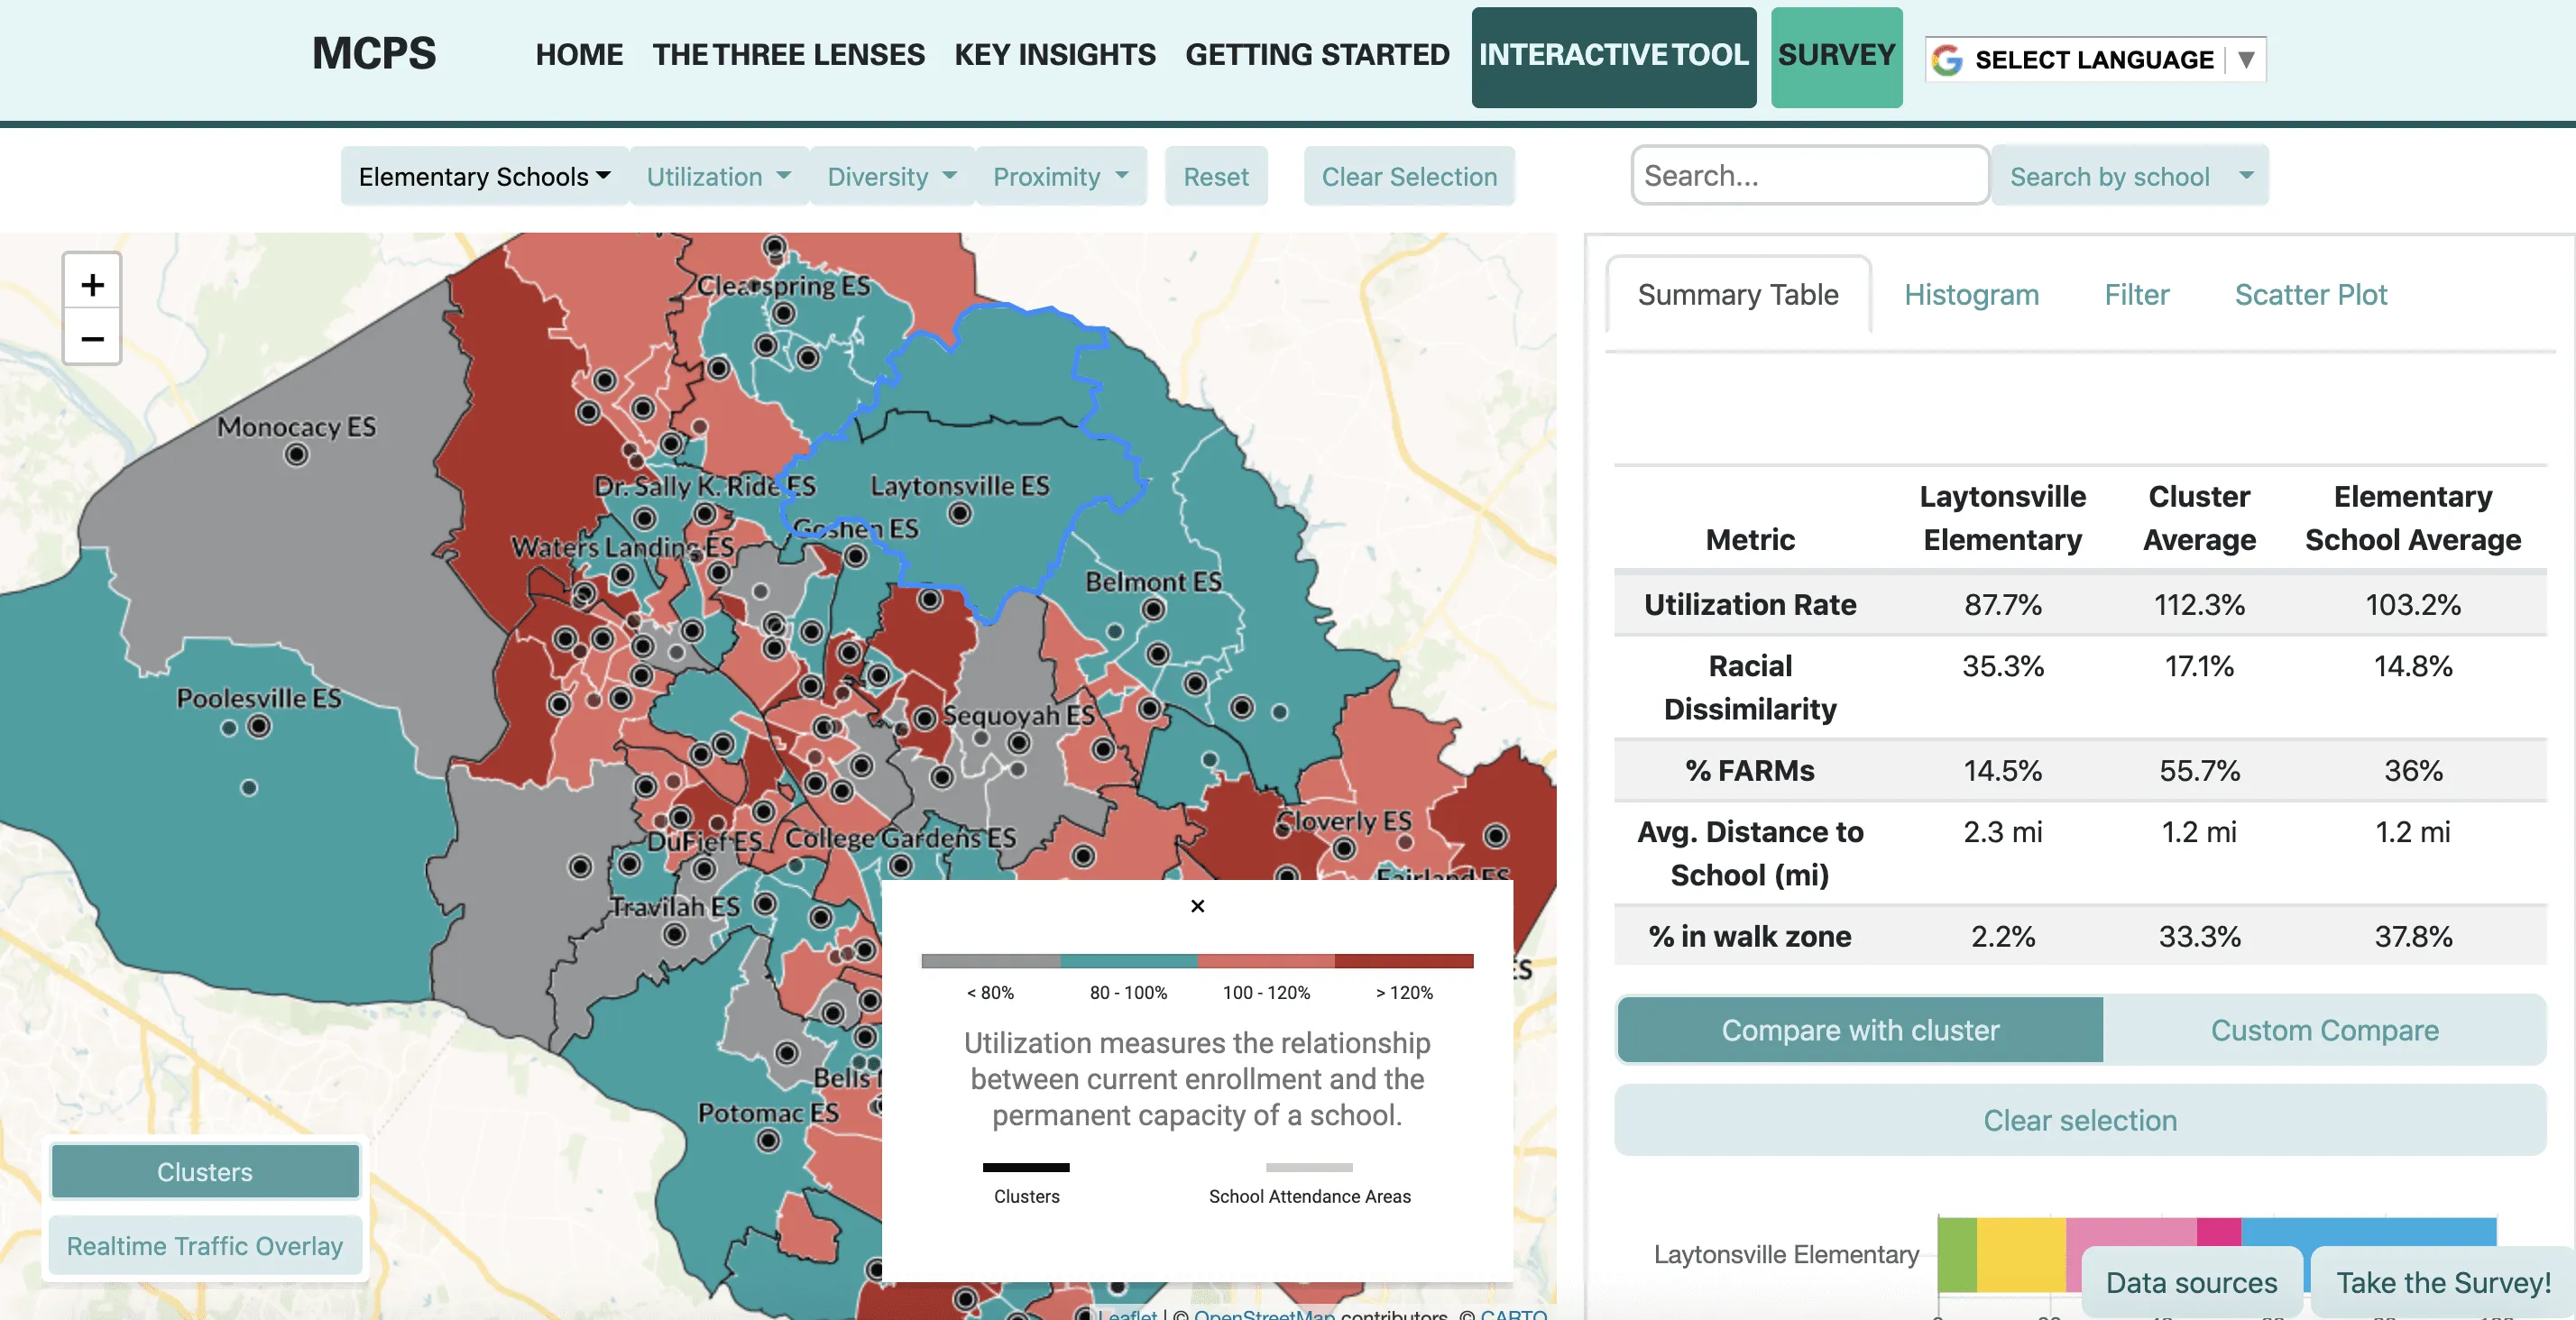
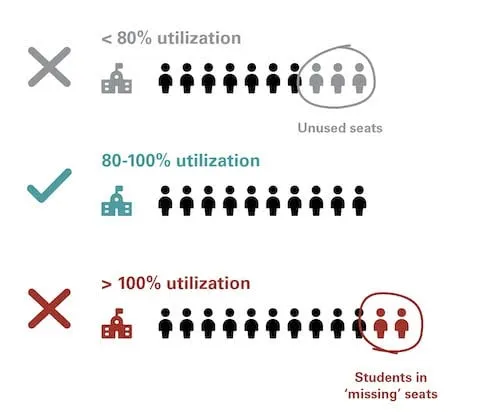
To build the platform WXY used CARTOframes and CARTO.js to create dynamic visualizations and add interactive layers to the IBE. This level of interactivity allows users to view data through three lenses of analysis: school utilization diversity between schools and distances traveled to schools.

Users can toggle between analysis views select and analyze specific school clusters overlay traffic data and make custom comparisons to capture new findings and answer questions such as:
What do utilization rates look like across the district today?
How are socio-economic and language diversity related within MCPS?
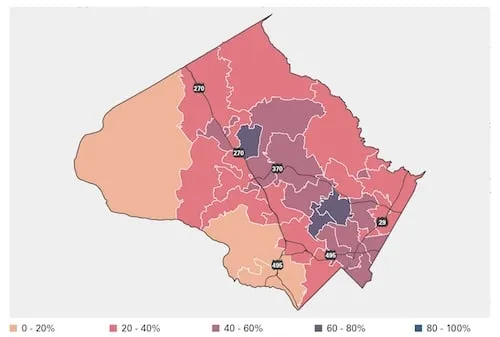
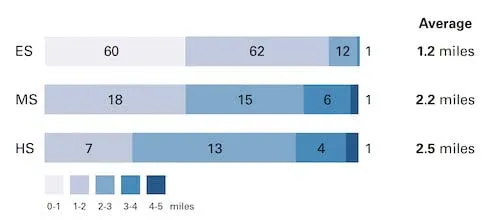
How far do MCPS students travel to school?
Key Benefits
So what are the key benefits in creating an interactive tool that residents and stakeholders can use to visualize and analyze MCSP school data?
Comprehensive Analysis
Prior to WXY’s analysis MCPS had never conducted a system wide review before. Using the CARTO platform WXY was able to visualize their data and provide Montgomery county residents with a holistic view into their school systems and the analysis taking place.
Transparency
A major goal in building the IBE was to create transparency within the community. Through the explorer tool residents have direct access to the data that’s driving important decisions within their public school system. This provides clarity as to why things are happening and the rationale behind it.
Inclusivity
Given the multilingual nature of MCPS it was necessary that the platform was accessible to the whole community. To accommodate this the entire IBE is designed to be used in multiple languages.
They also knew that the community would have different levels of experience with analyzing data so resources like how-to videos were created (also available in different languages) covering topics like tool orientation how to search your school and read the summary table how to use a scatterplot and more. These extra steps ensure that the platform is accessible to everyone.
Community Involvement
By equipping the community with the most up-to-date insights they are empowered to conduct their own analysis have conversations and share their feedback. Using the CARTO platform WXY was able to create a transparent process that encourages dialogue between MCPS and its residents based on real-time data and facts. This is especially made true by the online survey where users can share their input which will be included in the final report to the Board of Education.
For more information about the MCPS Interactive Boundary Explorer click here.
Looking to build a similar solution?