

Driving down distribution costs with Location Intelligence


The logistics industry is under increasing pressure thanks to rising costs a shrinking labor force and unrealistic customer expectations for priority deliveries. Even Amazon is not immune to these changes. Between 2015 and 2017 the ecommerce retailer’s shipping costs skyrocketed from $11.5 billion to $21.7 billion.
Logistics optimization problems are notoriously difficult to solve. However with spatial data science we can build data models that simulate existing network conditions providing us insights on existing constraints inefficient territory assignments and much more.
The growing competition among large retailers big-box department stores ecommerce startups and third party logistics providers (3PLs) is likely to cause further disruptions which is why it is more important than ever to prepare contingency logistics plans. Below we’ll build a network model to enable a more sophisticated approach to logistics planning.
Transportation problems in first mile logistics network
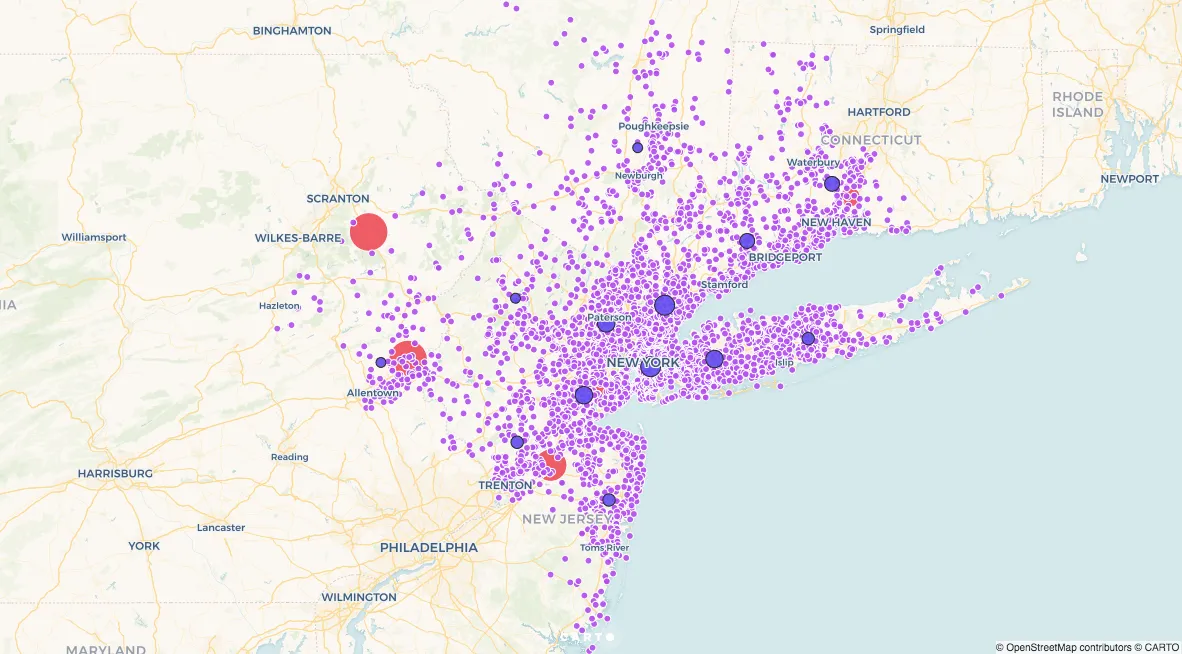
“How can goods be distributed from supply points to demand points at the lowest possible costs?” drives many logistics optimization projects. For this scenario we’ll answer this question from the perspective of a retail company tasked with shipping 6 000 parcels across the Greater New York City region using its existing distribution network of 5 warehouses and 13 fulfillment centers. The map below gives a sense of the project’s scope:
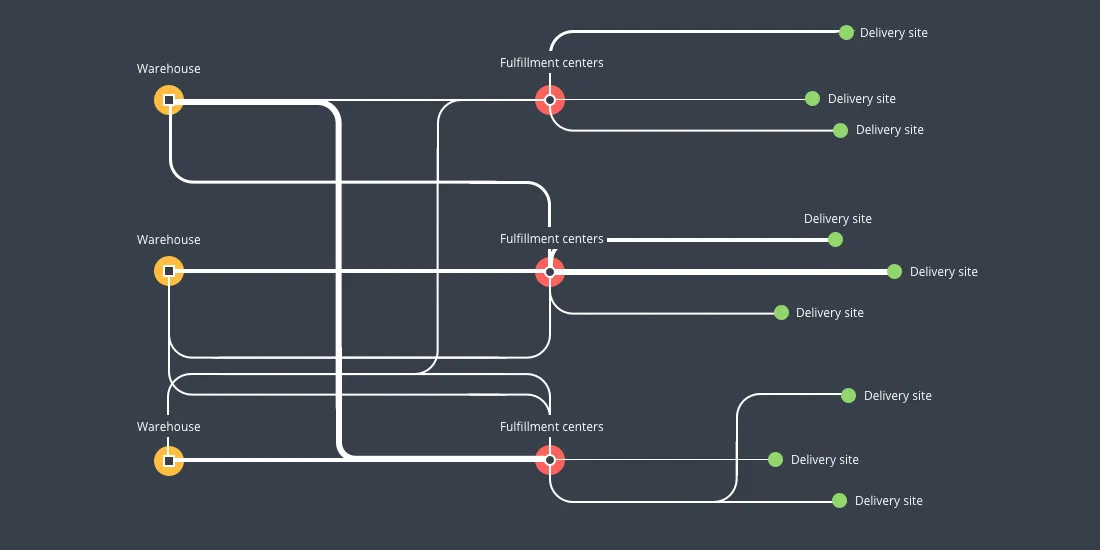
Our goal is to define distribution routes moving supplies from warehouses to fulfillment centers and finally to delivery address. In data science network models can solve transportation problems by redirecting the flow of goods along optimal routes in light of network constraints. The diagram below presents an overview of this various computations involved in determining optimal shipping routes.
In our scenario distance traveled shipping costs and processing costs are optimization factors since finding lowest possible distribution costs we will be looking to reduce fuel and labor costs. The road network provides distance traveled and shipping and processing estimates are based on past costs:
- Shipments from warehouse to fulfillment center cost on average $0.002 per kilometer per package
- Shipments from fulfillment center to delivery address cost on average $0.005 per kilometer per package
- Fulfillment centers and warehouses have estimates for the total cost for processing a package which vary from $0.90 to $1.36 for fulfillment centers and $0.84 to $1.99 for the warehouses
Although it seems sensible to base shipping routes on proximity of warehouse fulfillment center and delivery addresses this approach overlooks fulfillment center and warehouse capacity levels and their respective processing costs. The primary objective is to deliver goods to customers within a certain period of time. When fulfillment centers are overwhelmed parcel deliveries can be delayed damaged returned or even lost which can increase costs and decrease customer satisfaction.
Building an Origin-Destination Matrix
In order to solve this transportation problem we need to find the global combination of possible routes at the lowest possible costs while also ensuring that the constraints are met:
- Fulfillment centers do not exceed capacity limits
- All packages are delivered
We’ll need to create an Origin-Destination Matrix (ODM) using the road network to determine the global combinations for distance and time travel estimates. ODMs are useful when solving spatial problems because they give all possible paths between origins and destinations to help decide on which permutation of visit order to pick (e.g. traveling salesman type problems) or which combinations of origin/destinations for logistics delivery problems (e.g. network problems).
For this problem we’ll be working mostly in Python a popular choice for data scientists. Why Python? This programming language’s framework allows one to easily connect with services like Valhalla an open source routing software needed to build our OD matrix and CARTO thanks to CARTOframes.
Finding all possible transportation routes requires building 2 OD matrices showing paths (1) from warehouses to fulfillment centers and (2) from fulfillment centers to delivery addresses. Location data on our warehouses fulfillment centers and customer addresses will be needed to complete both OD matrices. OD matrices bring together a lot of information. However as the map of warehouse to fulfillment centers below illustrates we’re still not sure which routes are most cost effective (let alone what routes from fulfillment center to delivery addresses!).
While the map shows only straight-line distances between OD pairs the road distance and time of traversal are used in the optimization problem and the straight lines are used for clearer cartography here.
Why geospatial data is transforming logistics industry
Attend our next breakfast event in Madrid and discover ways to drive logistics optimization with Location Intelligence
Register Today
Designing a Logistics Optimization Algorithm
Now we need to design an algorithm that applies the constraints defined in section one to the data gathered in section two so that this information is filtered down to the network’s optimal routes.
Our basic model that we are minimizing over -- our objective function-- is the following:
num packages * (transport cost * distance + transfer processing cost)
+
num packages * (transport cost * distance + warehouse processing cost)
The map below represents our optimized network model based on the most cost-effective shipping assignments given our input data:
The map shows the following information:
- The warehouses (red circles) and fulfillment centers (purple circles) are rendered in proportion to their capacity
- The black lines represent the number of parcels shipped from warehouses to fulfillment centers
- The colored regions represent each fulfillment center’s delivery area
- For each delivery area the number of parcel packages and average costs of deliveries are calculated
With this information we can calculate the costs of distributing 6 000 packages from warehouses to fulfillment centers along the most cost-effective routes to be $41 988.37. At the same time we notice some fulfillment centers are serviced by multiple warehouses especially the one located in Brooklyn which handles the bulk of New York City deliveries. The processing fees at each warehouse however vary quite a bit:
- North Haven Connecticut: $.84 per package
- Gouldsboro Pennsylvania: $.94 per package
- Easton Pennsylvania: $1.34 per package
- Carteret New Jersey: $1.72 per package
- Cranbury New Jersey: $1.99 per package
If processing capacity were increased at warehouses with lower processing fees that would enable us to lower total distribution costs as parcel packages would be redistributed through warehouses with lower fees.
After capacity constraints were readjusted we ran our objective function algorithm again which eliminated the Cranbury warehouse from our network since parcels cost the most to ship from this location. In making this change in our network total distribution costs from warehouse to fulfillment center now amount to $35 121 reducing costs by $6 866.71.
The Location Intelligence imperative in logistics
With this algorithm we can extend our analysis beyond optimal delivery assignments. For instance we can run scenarios that calculate the costs of removing a fulfillment center from our network if there were a power outage or natural disaster impacting operations at a given site. Another option would be to find optimal routes at certain times of day to help our fleet avoid traffic and high toll prices by adding advanced truck routing and TomTom GPS data.
While these scenarios only go as far as the quality of the data and complexity of the model they demonstrate the benefits of working with spatial data science when addressing logistics problems.
Addressing the location imperative in logistics planning
Attend our next breakfast event in New York to learn how Location Intelligence is driving logistics planning


