

Mobile Data 101: 15 Questions to Answer Using Mobile Data


Understanding the patterns and trends in the everyday actions of citizens workers or consumers is key to answering complex business questions. 90% of smartphone users keep their mobile device within reach 24 hours a day 365 days a year. This makes mobile data a potent tool for analyzing trends and solving today's greatest challenges.
In part 1 of our two-part Mobile Data 101 series we examined some of the challenges and best practices to keep in mind when beginning to work with the different types of mobile data. We also discussed privacy and security and how it should inform data storage management and use policies. The importance of protecting individual privacy while working with mobile data sets cannot be stated strongly enough. Using techniques like aggregation and anonymization are absolutely critical when answering questions like those below.
When used properly and safely the range of business and policy questions that mobile data can help answer is vast. In this post we take a look at several examples broken down by industry to provide a deeper sense of when mobile data should be employed towards answering a question or solving a problem.
Power Retail Management with Mobile Data
Whether you are a strategist working on-site planning and competitor analysis or a regional manager looking to understand local customer demographics using mobile data can provide an edge in understanding your business.
- What kind of foot traffic will my new location receive?
- How does my customer base differ from my competitor's?
- How do changes in foot traffic correlate with changes in sales?
- Is one of my locations cannibalizing business from one of my other stores?
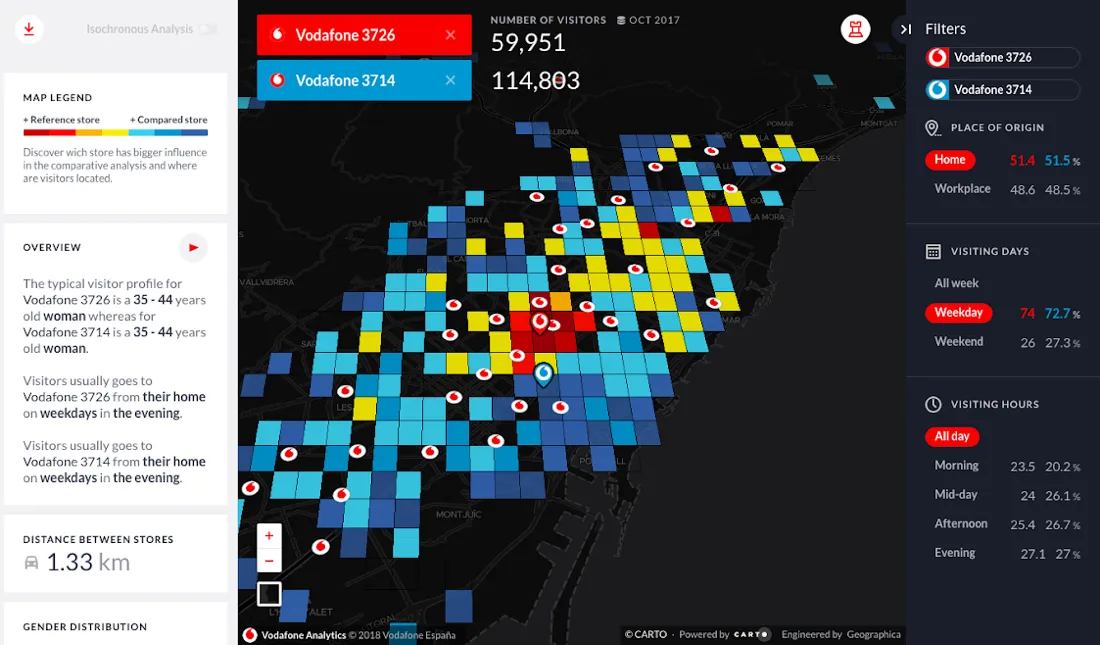
The above example highlights the use of area of influence analysis when comparing two distinct stores or locations. With a lot of information visualized this tool can help site planners geomarketers or retail managers.
The areas of influence themselves presented in contrasting color can inform a site planner as to the impact and draw that a specific store has over an area or where a new location may entice new customers without cannibalizing business. The map also provides helpful demographic info letting a retail manager understand who is shopping at their store where they are coming from and when they are most likely to visit.
All of this information can help with marketing efforts telling a strategist where and when an advertisement will have the maximum impact and expand a particular store's customer base.
Learn more about how mobile data can be converted into geospatial insights by checking out our recent webinar on Vodafone Analytics. Watch it Today
Smart Cities: Infrastructure Transit and Mobility
Understanding how people move and behave is imperative to city planners and transportation managers working day and night to build smarter cities. In many cases mobile data can paint a more vivid picture of this movement than traditional sensors.
- How active is my city?
- How and where are public spaces used or underused?
This map of Prospect Park from our data story A Million Walks In the Park shows how using spatial analytics can answer a number of questions around park management and usage. The use of a spatial clustering analysis elucidates several key facts about the park. By calculating dwell time our team was able to create clusters that highlight the points of interest in the park that receive the most visits or foot traffic. This kind of information can inform future programming or projects in Prospect Park or other parks around the city as well as infrastructural decisions such as placement of waste and recycling bins.
The map also shows where individuals tend to enter the Prospect Park which can be useful when planning for major events held there such as BRICs Celebrate Brooklyn Festival which boasts a quarter of a million attendees and determining alternative routing during those events.
The map also uses widgets to allow the user to narrow down their view by day of the week day of the month and time of day. By manipulating these histograms and selectors you have access to an extremely granular view of park usage. This data can help inform decisions around maintenance scheduling enforcement of closing times park programming and more.
- Where should we expand our public transportation network?
- How can we reduce traffic congestion?
- Where do we need more bike lanes?
- What areas see the most unsafe driving?
Using mobile data to investigate traffic patterns as shown here can help traffic managers to make decisions that can save lives.
This map uses navigation system GPS data to track the course and speed of vehicles around Berlin in a time series across a 24 hour period. The map also layers in school zones around the city where speeding is particularly problematic and puts children at risk.
By manipulating the histograms for speed and time of day on the map a traffic manager could inform decisions around adjusting speed limits improving signage and increasing traffic enforcement. Using mobile data in this way can prevent accidents and save lives.
Geomarketing with Pinpoint Accuracy using Mobile Data
The savvy marketer understands that where you advertise is just as important as how you advertise. Using Telco data can paint a clear demographic picture and show you where your customers spend their time.
- Are my billboards driving foot traffic to my retail location?
- Where will my advertisement create the most impressions with my target demographic?
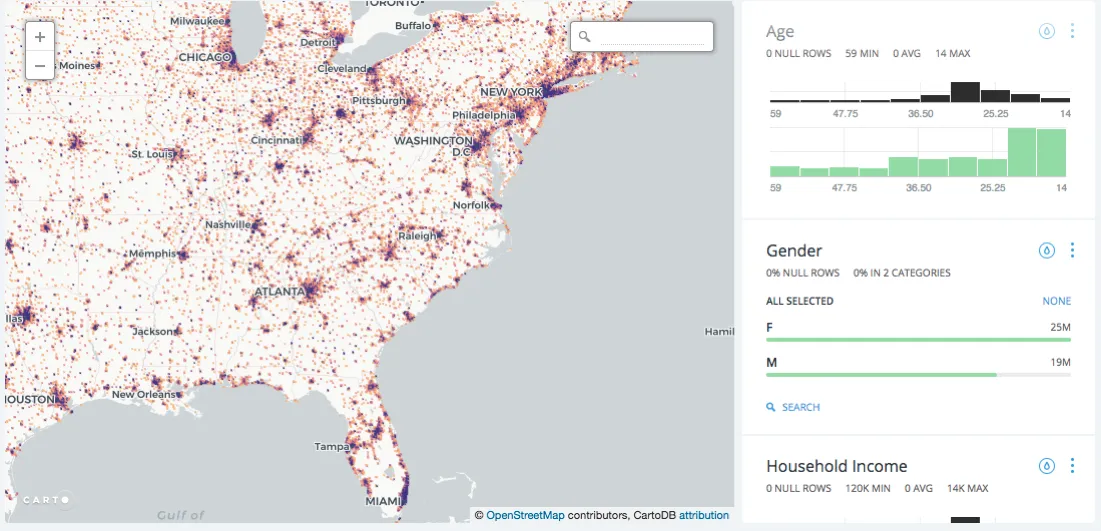
Filtering mobile data with demographics as seen in the above map which shows advertisement impressions across the United States and has widgets that allow filtering on age gender and household income can show you exactly where marketing messages are having an impact and with whom.
Combining an understanding of the target audience with where they are engaging with advertising content is critical to informing marketing decisions and getting the most bang for your buck with every ad.
Mobile Data Drives Smart Real Estate Development
Success in commercial real estate requires analysts to quickly and accurately assess potential profitability. Location Intelligence applications are becoming a major part of real estate development strategy. Integrating mobile data can help paint a picture of target neighborhoods and allow developers to predict outcomes early on.
- Will my real estate development draw enough buyers?
- Can I more intelligently predict changes in property value?
- What are the up and coming neighborhoods based on visitor foot traffic?
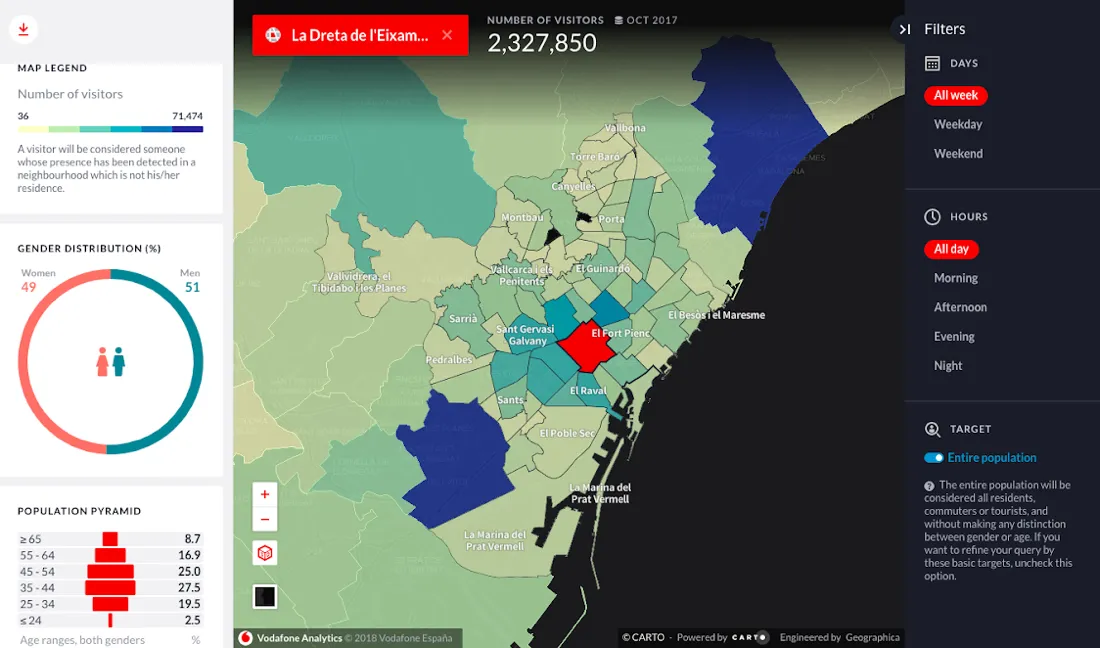
Understanding the demographic makeup of a neighborhood can allow developers to make confident decisions knowing where target buyers and consumers work and play.
The above map uses telco data to visualize the quantity and demographic makeup of the visitors to Barcelona's distinct districts. Whether you are developing new commercial industrial or residential properties being able to visualize who lives or spends time in your target neighborhood is critical for predicting profitability educating investors or investors-to-be and making smart design choices throughout the development process.
In the Real Estate industry and across all of the industries listed here and beyond visualizing mobile data and drawing insights through spatial analytics is becoming best practice and is critical for data-driven decision making.
Want to learn more about the advantages of incorporating mobile data into your decision making strategy? Join us at CARTO Locations.


