What's New in CARTO - Q2 2022


As we approach the midpoint of the year it is time for us to share with you some of the exciting new enhancements we have developed for the most recent release of the CARTO platform.
Our teams are working tirelessly to build the most powerful spatial analytics platform available and to supercharge users of the leading cloud data warehouses such as Google BigQuery Snowflake Redshift and Databricks with unique geospatial analysis and visualization capabilities.
The main focus of this past quarter for us have been spatial indexes and their associated hierarchical grids - H3 Quadgrid S2; for which we have developed native support across all of our different interfaces from Builder the Analytics Toolbox to our tools for developers unlocking much more performant geospatial analytics at a very large scale. But we haven’t stopped there! We have been actively adding a host of important new features across all components of the platform.
In this post we will highlight some of the main releases we have done in the last three months; please refer to our product documentation for further details. So let’s take a look!
Native support for Spatial Indexes across our platform interfaces for more performant analytics
These last few months we have been working on the native support of spatial indexes across our different interfaces. Spatial indexes are data structures that when used to encode the location and resolution of a cell within a hierarchical global grid such as H3 S2 or Quadgrid allow us to unlock geospatial analytics for very large datasets bringing radical savings in processing and rendering times reducing memory and storage usage.
Leveraging these global grid systems also allows for more effective visualizations storage and the development of simple and efficient geospatial algorithms as highlighted in this recent blogpost on the use of H3.
Now Builder users can load visualize and process tables tilesets and results from SQL queries that contain spatial indexes without the need for geometry data. The resulting visualization is then aggregated dynamically at each zoom level allowing data to be always represented in the most meaningful resolution.
Our Analytics Toolbox on the other hand enables users to operate with spatial indexes natively in BigQuery Snowflake AWS Redshift and any PostgreSQL database; providing functions that cover varied use-cases from the performance of traverse operations aggregations and advanced statistical analysis to the generation of tilesets.
Additionally the recently published new versions of CARTO for deck.gl 8.8 and CARTO for React 1.3 (that will be released in the coming days) aimed at our community of web developers who are building spatial applications also offers the possibility to build visualizations and analyze large tables and tilesets based on spatial indexes without the need to operate with complex geometry data.
Watch our co-founder and CSO Javier de la Torre’s opening keynote at the 2022 Spatial Data Science Conference to see how spatial indexes will power the next generation of spatial analytics at scale.
Point & Click SQL analyses and enhanced interactive and cartographic capabilities in Builder
We have enhanced Builder our map making tool with a collection of SQL analyses that can be configured and run with a point-and-click interface. Users can now perform intersect & aggregate operations between data sources create buffers join columns from multiple tables calculate centroids and clusters generate trade areas etc. and all of this in a matter of a few clicks. All of these analyses are performed as SQL queries and run natively within the different cloud data warehouses supported in our platform.
In terms of improving the cartographic capabilities of the tool we have now released the support for custom breaks for color ramps the option to control the visibility of layers depending on the zoom level as well as a more advanced color picker and the incorporation of our CARTOcolors.
On interactivity enhancements this quarter we have also improved the appearance and functionality of our map tooltips; with more options to configure how data is displayed tooltip behavior etc.
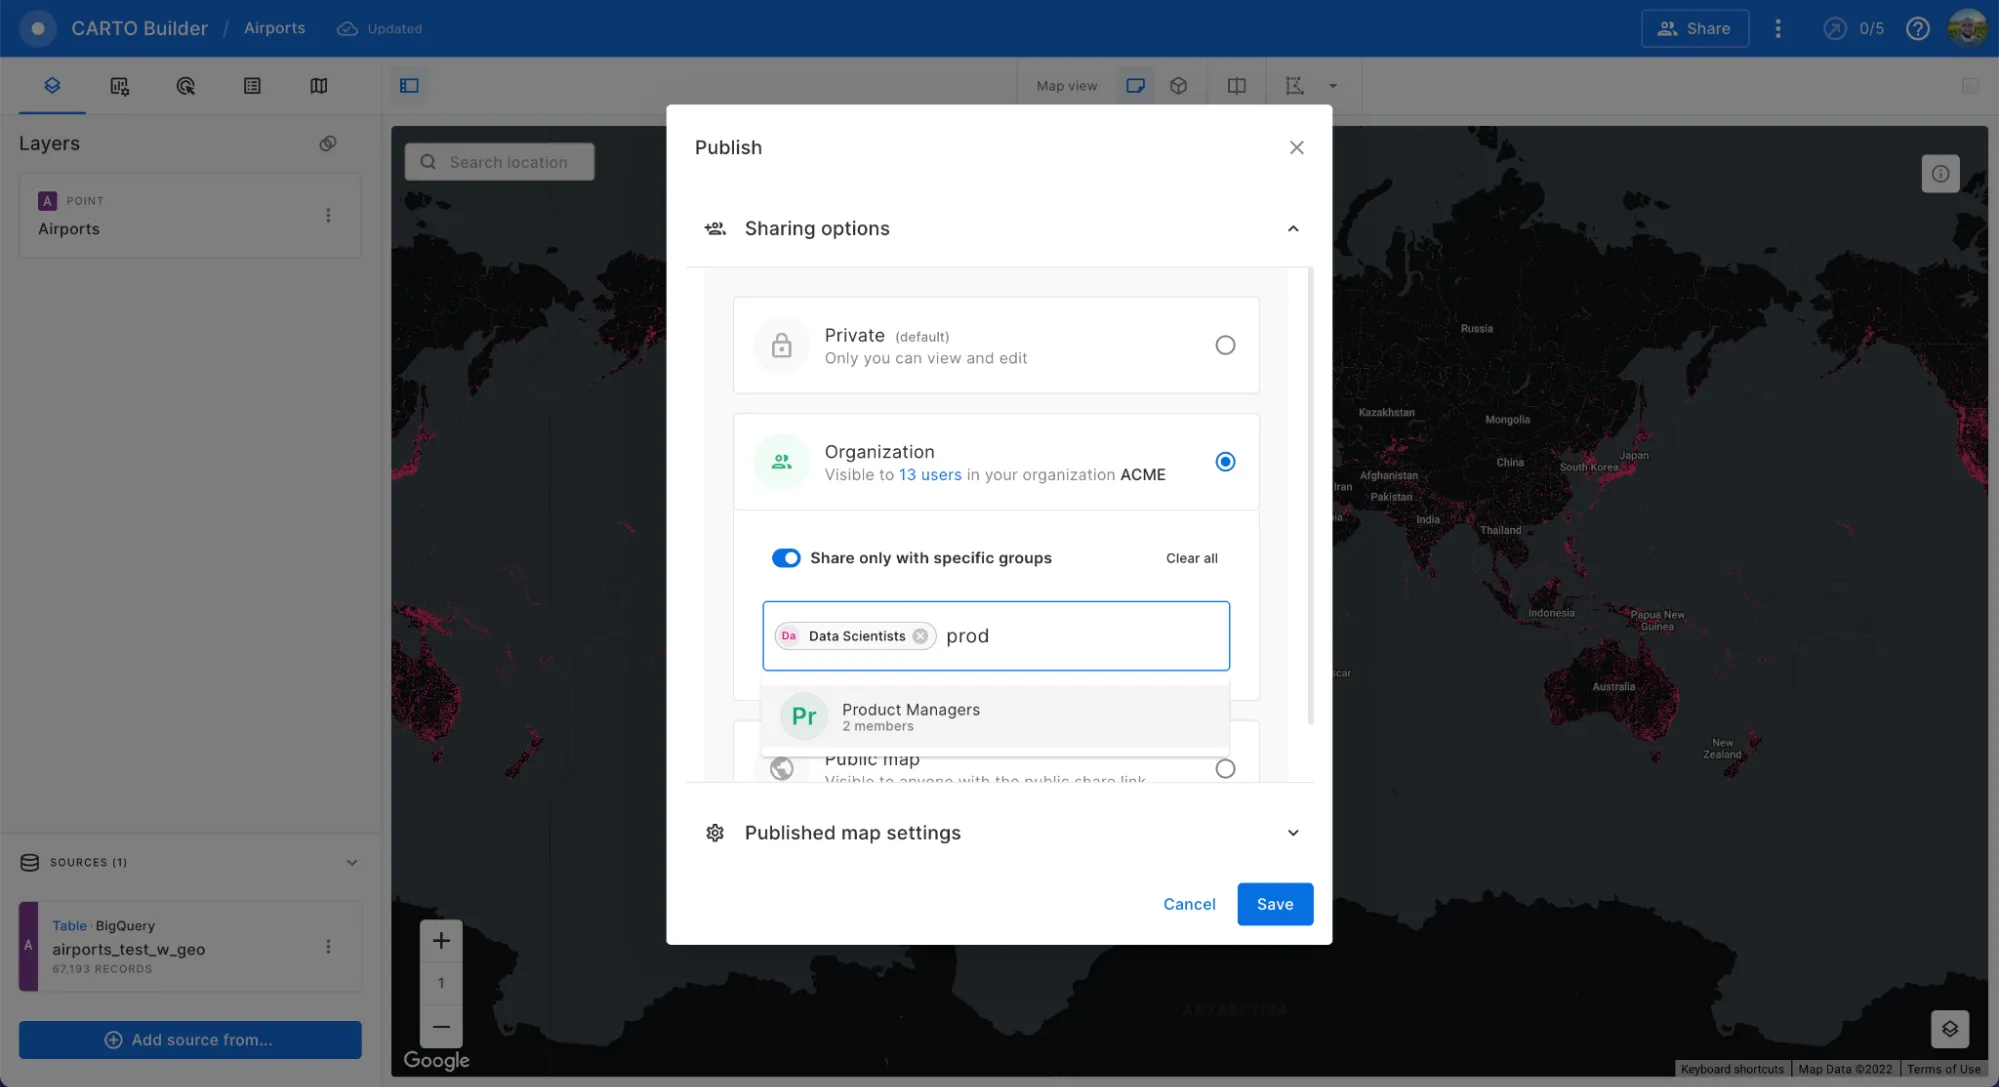
We have also extended the features that can be included in shared and public maps in order to improve their interactivity with viewer-only users. Editors can now configure the shared versions of their maps with features such as password protection address search bar zoom controls and the inclusion of the feature selection tool.
Enrich your data with features from Data Observatory subscriptions via the Data Explorer
Our users can now enrich their tables with features from their Data Observatory subscriptions with the help of a UI available in the Data Explorer. With this workflow in a matter of a few clicks users can bring together their own data with variables available in their data subscriptions to enable and accelerate richer spatial analysis and insights. Our Data Observatory already contains an offering of more than 11 000 spatial datasets from the best public and premium sources and with this new interface we further streamline the workflows of data analysts and data scientists looking to enrich their analyses by leveraging external data.
Extended group sharing and customization capabilities for the larger enterprise plans
In line with our objective of building the most powerful enterprise-grade platform for spatial analytics this last quarter we have implemented the option for organizations on our larger enterprise subscription plans to synchronize groups from the users directory (IdP) via SAML and other protocols. This allows users to be able to share their different maps and data warehouse connections with different groups within their organization.
Additionally we have also implemented the option to be able to customize the look and feel of the CARTO Workspace and Builder interfaces to align with the branding guidelines of enterprises on these subscription plans.
CARTO for Retail a cloud native analytics platform designed specifically for Retailers
Last May we announced the launch of CARTO for Retail our integrated offering for global retailers looking to perform cloud native geospatial analytics at scale. With an end-to-end platform providing access to analytical methods data and applications CARTO for Retail addresses the most important data challenges faced by the sector today. Retailers can leverage our different tools to generate valuable location-based insights and tackle the most important strategic decisions such as where to locate new stores consolidate their existing physical footprint or optimize their supply chain networks.
We are really excited by this wave of enhancements to the CARTO platform and would like to thank our customers and partners for guiding this continued evolution.
If you would like to find out more about the enhancements we have developed and see the CARTO platform in action why not sign up to our Quick-Start Training taking place on 13th July 2022.